
Mini Project 1 · Danger Zone Monitoring
Practice building a Flow that reads video, detects people with a pre-trained model, counts how many are standing inside a defined zone, and raises an alert when someone walks into the danger area.
1. Overview
In the Operation chapter we read video frame by frame with a While Loop and branched a Flow with If-Then. This Mini Project puts both to work on something real: watching a danger area on a work site, and raising an alert the moment somebody walks into it.
What you'll build is a Flow that reads a video, detects people in every frame, then checks whether any of them are standing inside a zone we draw on the picture. If someone is, the Dashboard reports how many and switches the status to say a person was found in the danger area. If the area is clear, the count goes back to 0 and the status returns to safe.
The Node that makes this work is Detected Zones Counters. It takes the boxes from a detection Node and tells you what is sitting inside each zone.
2. Learning Objectives
By the end of this project, the learner will be able to:
- Read video with the Server Media Input Node and run detection frame by frame
- Use General Object Detection with NARA's pre-trained model to detect people
- Configure the Detected Zones Counters Node and draw zones on a reference image
- Read
countInsideandhasObjectsand use them to build conditions - Branch a Flow with If-Then so the status of the area follows what is in the zone
- Lay out a Dashboard showing video, count, and status together
3. Prerequisites
- Completed the basic course and able to build a Flow from scratch (see Build Your First Flow)
- Completed the Operation, since this project uses both the While Loop and If-Then
- Comfortable with General Object Detection and the Variable Nodes
- A video file or image to test with. This example uses footage of workers pouring concrete, but any clip that suits your own use case works
4. Expected Result
After deploying and pressing Start on the Dashboard, the video plays with detection boxes on it and the zone drawn over the top. As soon as someone walks into the zone, the number goes up and the status changes.
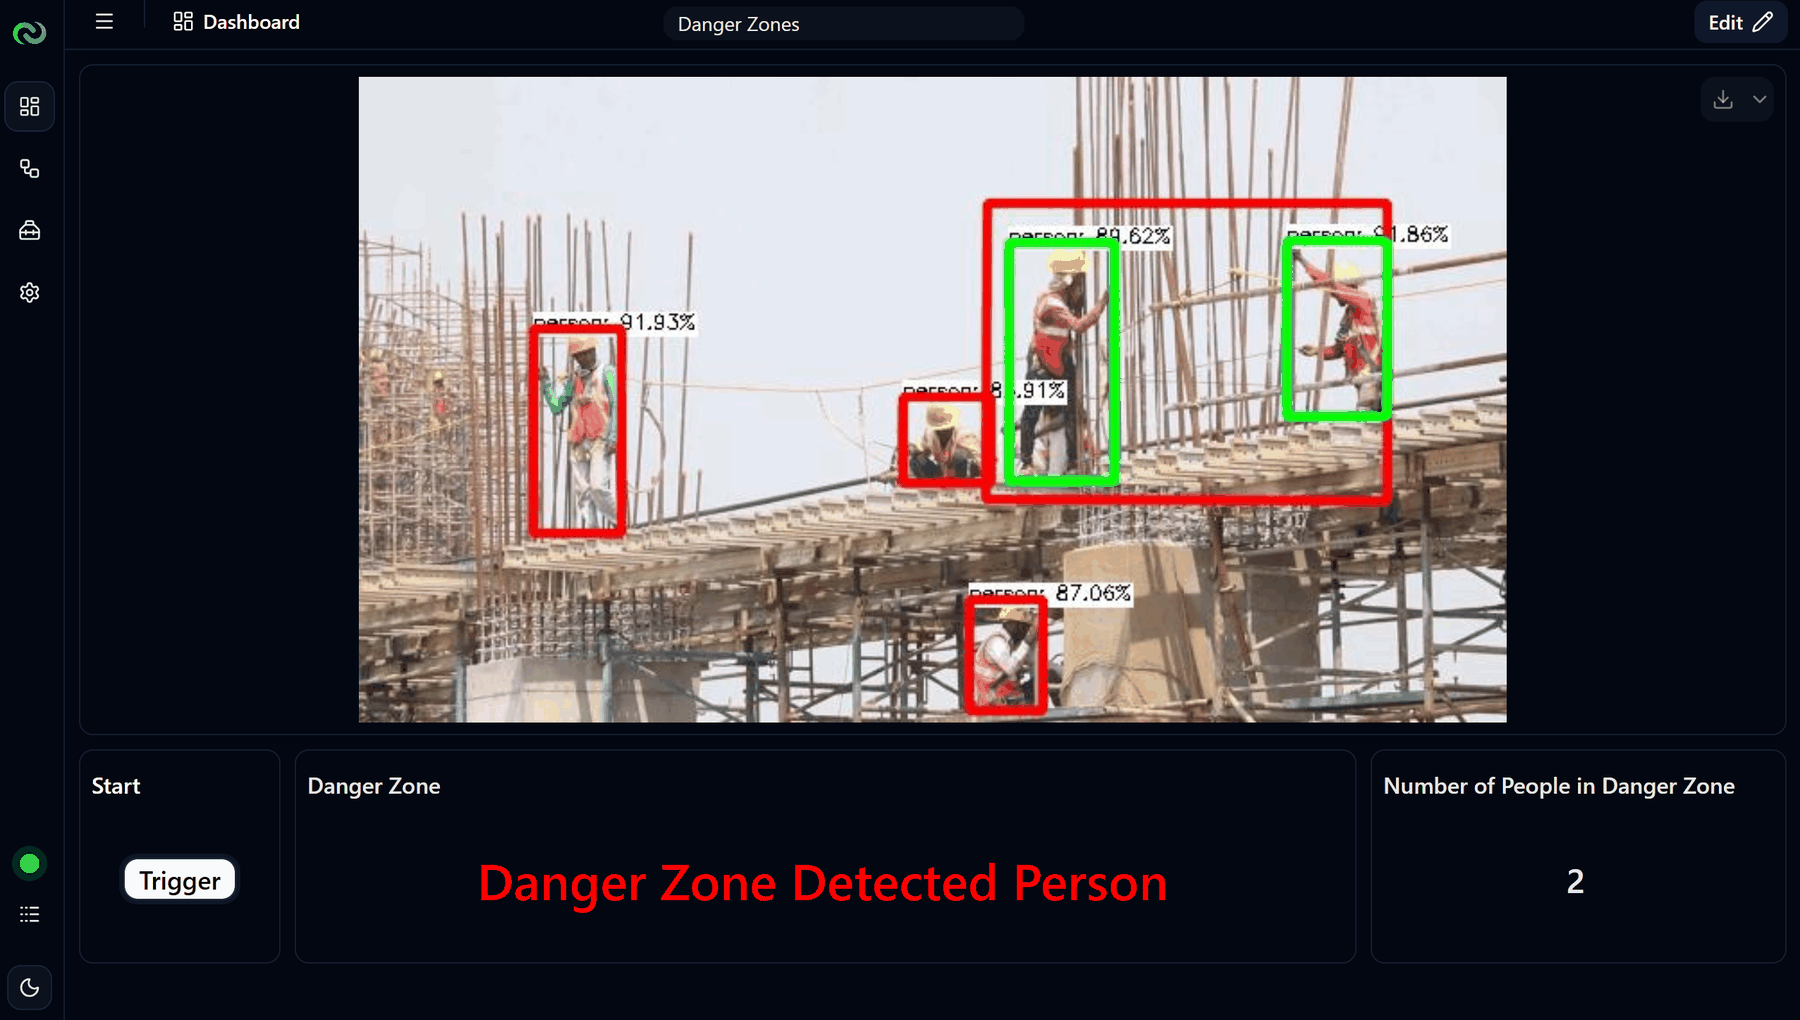
| Situation | Danger Zone | Number of People in Danger Zone |
|---|---|---|
| Nobody in the zone | No Person in Danger Zone | 0 |
| Two people in the zone | Danger Zone Detected Person | 2 |
5. System Architecture
Everything happens inside NARA, with nothing external to connect to. The video is the input, detection and zone counting are the processing, and the Dashboard is the output.
The thing to watch out for is that a single pass reads only one frame, so the whole chain has to sit inside a While Loop.
6. Flow Architecture & Nodes
The Flow uses the Nodes below. Anything that is basic configuration or left at its default is not spelled out again.
| Order | Node | Role |
|---|---|---|
| 1 | Trigger Node | Starts the Flow. Any Trigger works; this example uses a Dashboard Trigger so you can press Start yourself |
| 2 | While Loop | Repeats the work so every frame gets read |
| 3 | Server Media Input | The video or image to run detection on |
| 4 | General Object Detection | Detects people using NARA's pre-trained model. To detect something else, use Object Detection with a model from Reva instead |
| 5 | Detected Zones Counters | Creates the zone and counts what is inside it |
| 6 | Variable: Create Image | Holds the picture shown on the Dashboard |
| 7 | Variable: Modify Image | Updates that picture on every pass |
| 8 | If-Then | Checks whether anyone is inside the zone |
| 9 | Variable: Create Count | Holds the number of people in the zone |
| 10 | Variable: Modify Counting | Writes the count when someone is in the zone |
| 11 | Variable: Modify Reset Count | Puts the count back to 0 when the zone is clear |
| 12 | Variable: Create Danger Zone | The state of the danger area, stored as a Boolean |
| 13 | Variable: Modify Danger Zone (true) | Marks the area as dangerous when someone is in the zone |
| 14 | Variable: Modify Danger Zone (false) | Marks the area as clear when the zone is empty |
On the Dashboard side there are 4 Widgets:
- Basic Display × 2, for the Danger Zone status and the number of people in the zone
- Trigger Button × 1, for Start
- Image Frame × 1, for the video
7. Key Concepts
Core concept of this project
Detection tells you what is in the frame. A zone tells you where it matters. Put the two together and a stream of boxes turns into something the Flow can act on.
Detected Zones Counters checks and counts objects inside an area you define on the picture, such as a danger area, a work area, or an inspection point.
The important thing is that this Node does not detect anything itself. It takes bounding boxes from a Node such as Object Detection or Object Tracker, compares each one against the zones you drew, and reports the result zone by zone.
There are really only three things to set:
| Parameter | Value | Description |
|---|---|---|
| Input Image | The picture from the detection Node | The reference frame for placing zones and drawing results. Use the same picture the detection Node saw, so boxes and zones line up |
| Rectangular Objects | The list of bounding boxes | The boxes to check, taken from the detection Node |
| Zones | Reference image + the zones you draw | Where you draw the areas. The width and height, e.g. 1980 × 1080, must match the resolution of the picture being processed, or zone positions will drift |
And the values the Flow reads back out:
- frameOut image: the picture after processing, with the zone, reference point, and count drawn on it. This is what goes to the Dashboard
- hasObjects boolean: whether this frame has at least one object in the zone
- countInside number: how many objects are in the zone in this frame
- labels array: the labels of those objects, e.g.
["person", "person"]
It counts what is there now, not what passed through
countInside is the number of objects inside the zone at the moment that frame is processed, not a running total of everyone who has ever entered. Two people in the zone gives 2; once they all leave, it goes back to 0.
Zones are fixed to the picture
Zone positions follow the coordinates of the frame. If the camera moves or the angle changes, the zones do not follow the real area on their own. Use a fixed camera, or come back and redraw the zones whenever the view changes.
For the full parameter list and output schema, see the Detection Count Zones Node reference.
8. Guided Workshop
Part 1 · Read the video and detect
Start with just the video reading and person detection. When you create the While Loop, remember it needs its End connected, otherwise the pass never completes.
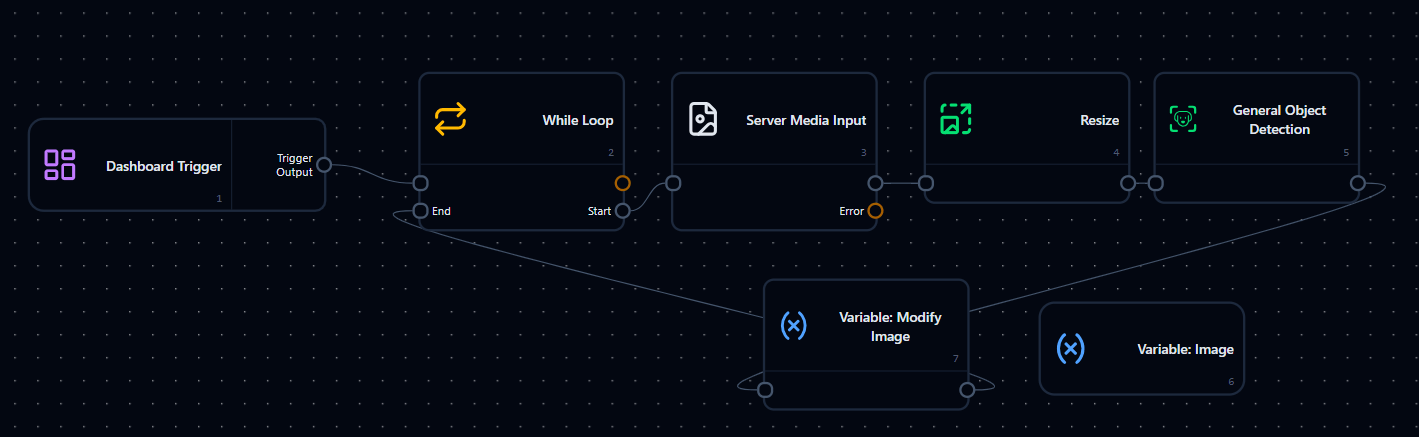
Configure the Nodes one at a time:
Node 1 · While Loop
Nothing to change yet. Leave Loop Delay at 0 for now; you can adjust it later.
Node 2 · Server Media Input
Load the video or image file you want to run detection on.
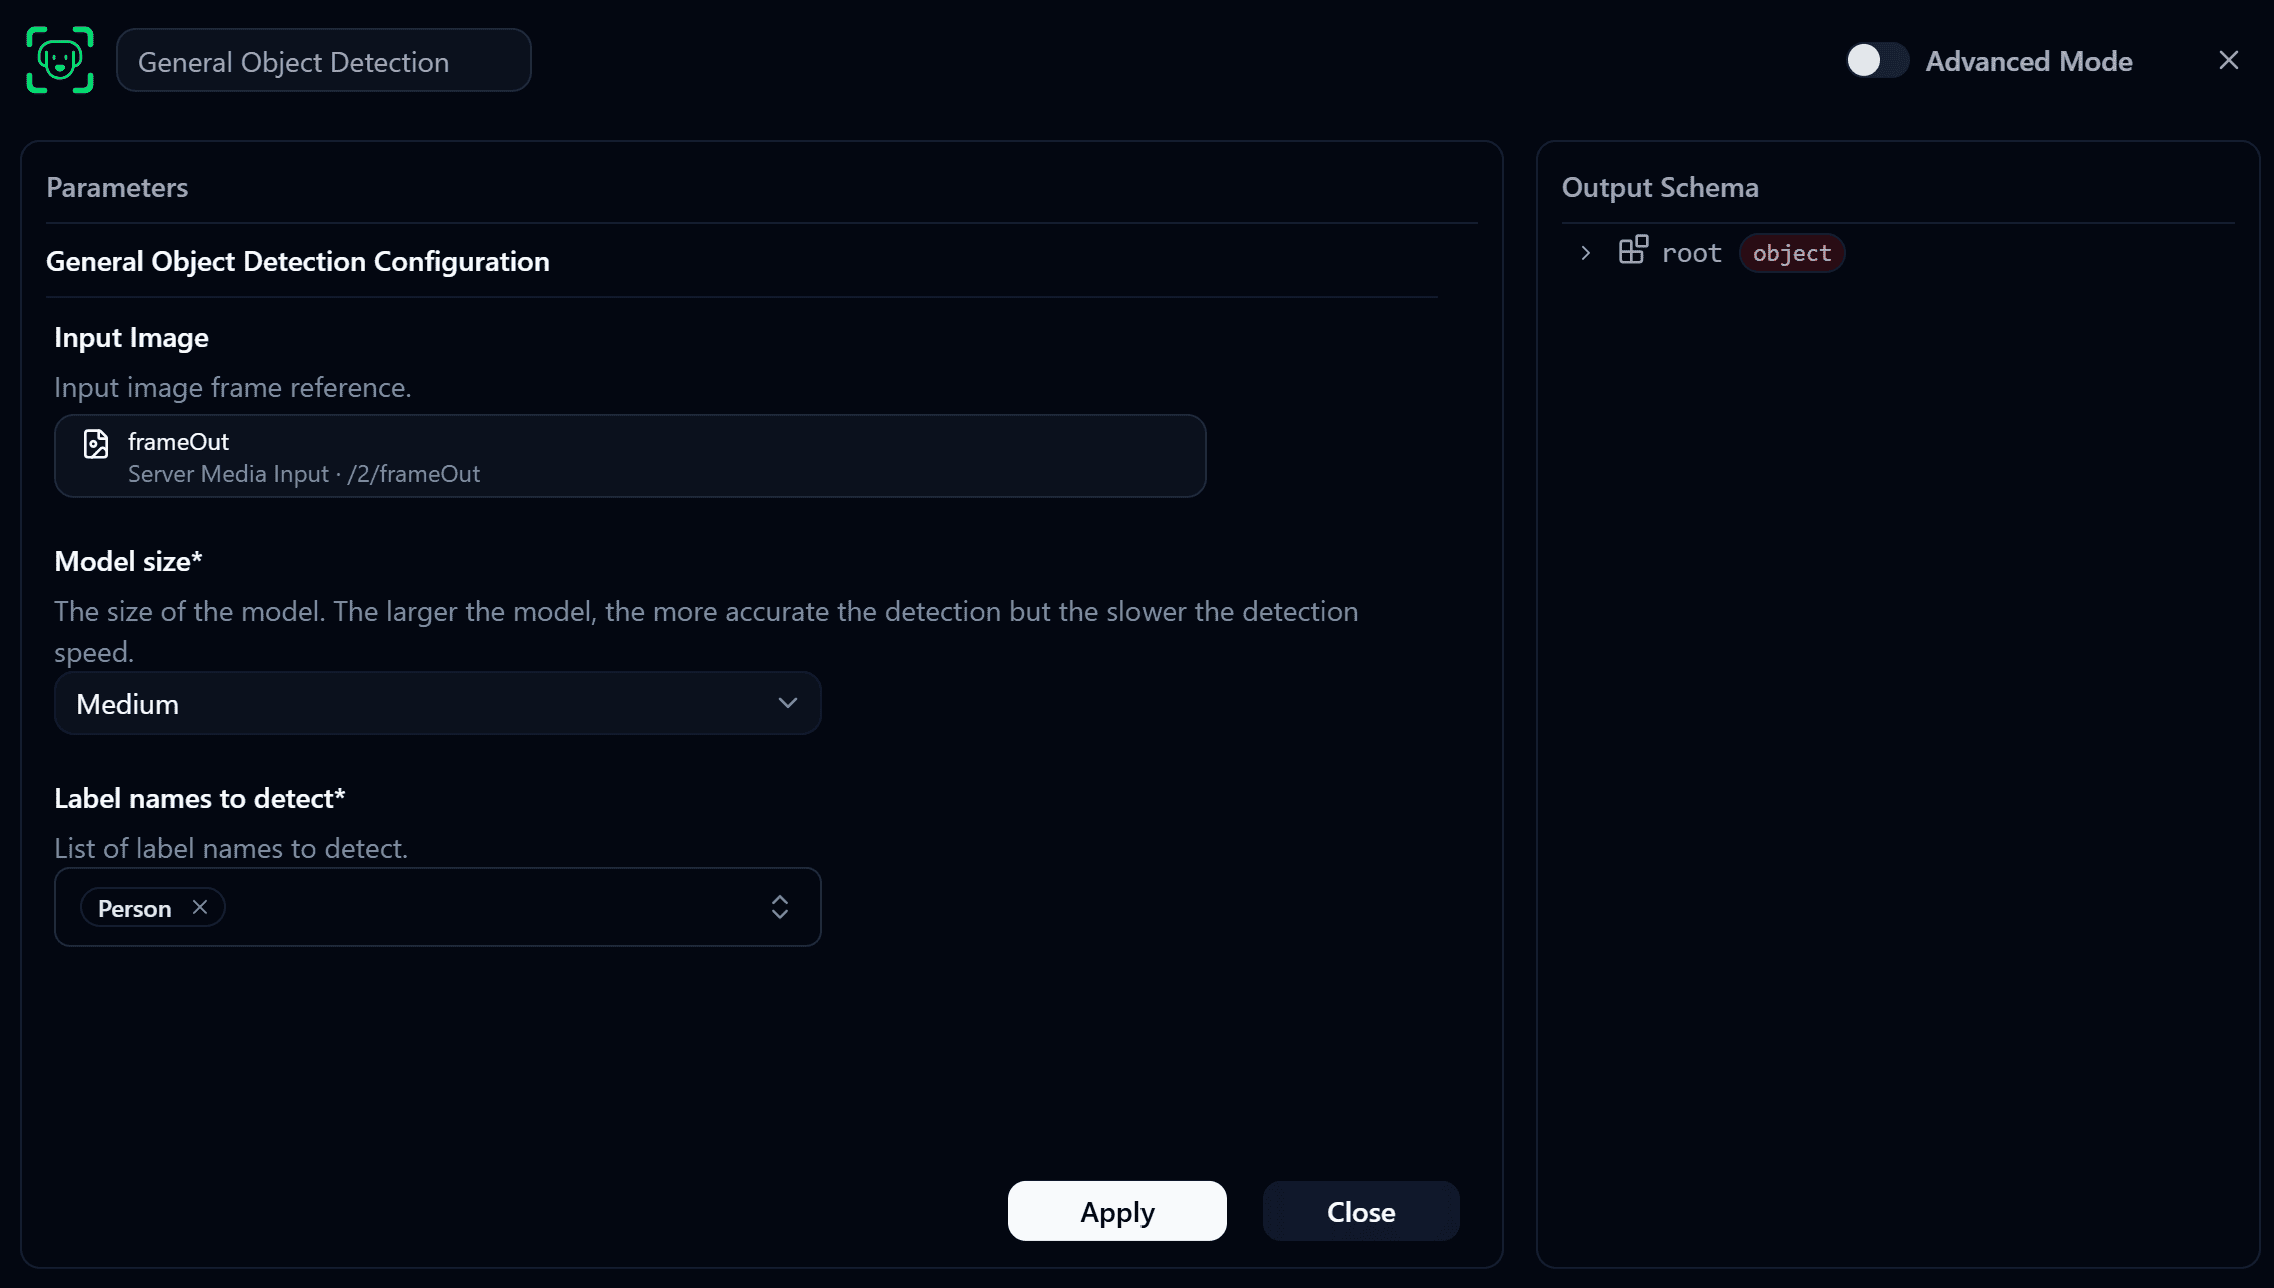
Node 3 · General Object Detection
| Parameter | Value | Description |
|---|---|---|
| Input Image | frameOut from Server Media Input | The picture to run detection on |
| Model size | As you like, e.g. Medium | A bigger model is more accurate but slower |
| Label names to detect | Person | Pick it from the dropdown; change it to something else if you want |
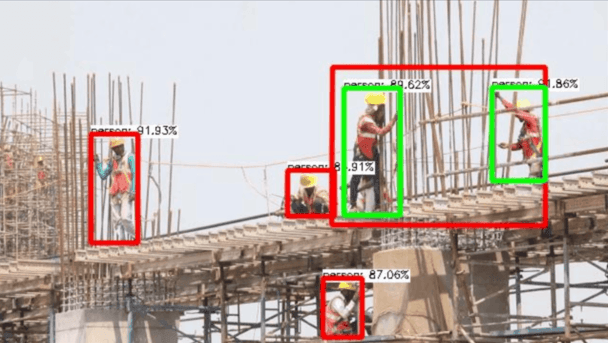
Deploy and check the Dashboard. The video should play, and people in the area should be detected.
Part 2 · Add Detected Zones Counters
Now add the Node that creates the area to watch. What we want to watch here is the people coming out of General Object Detection.
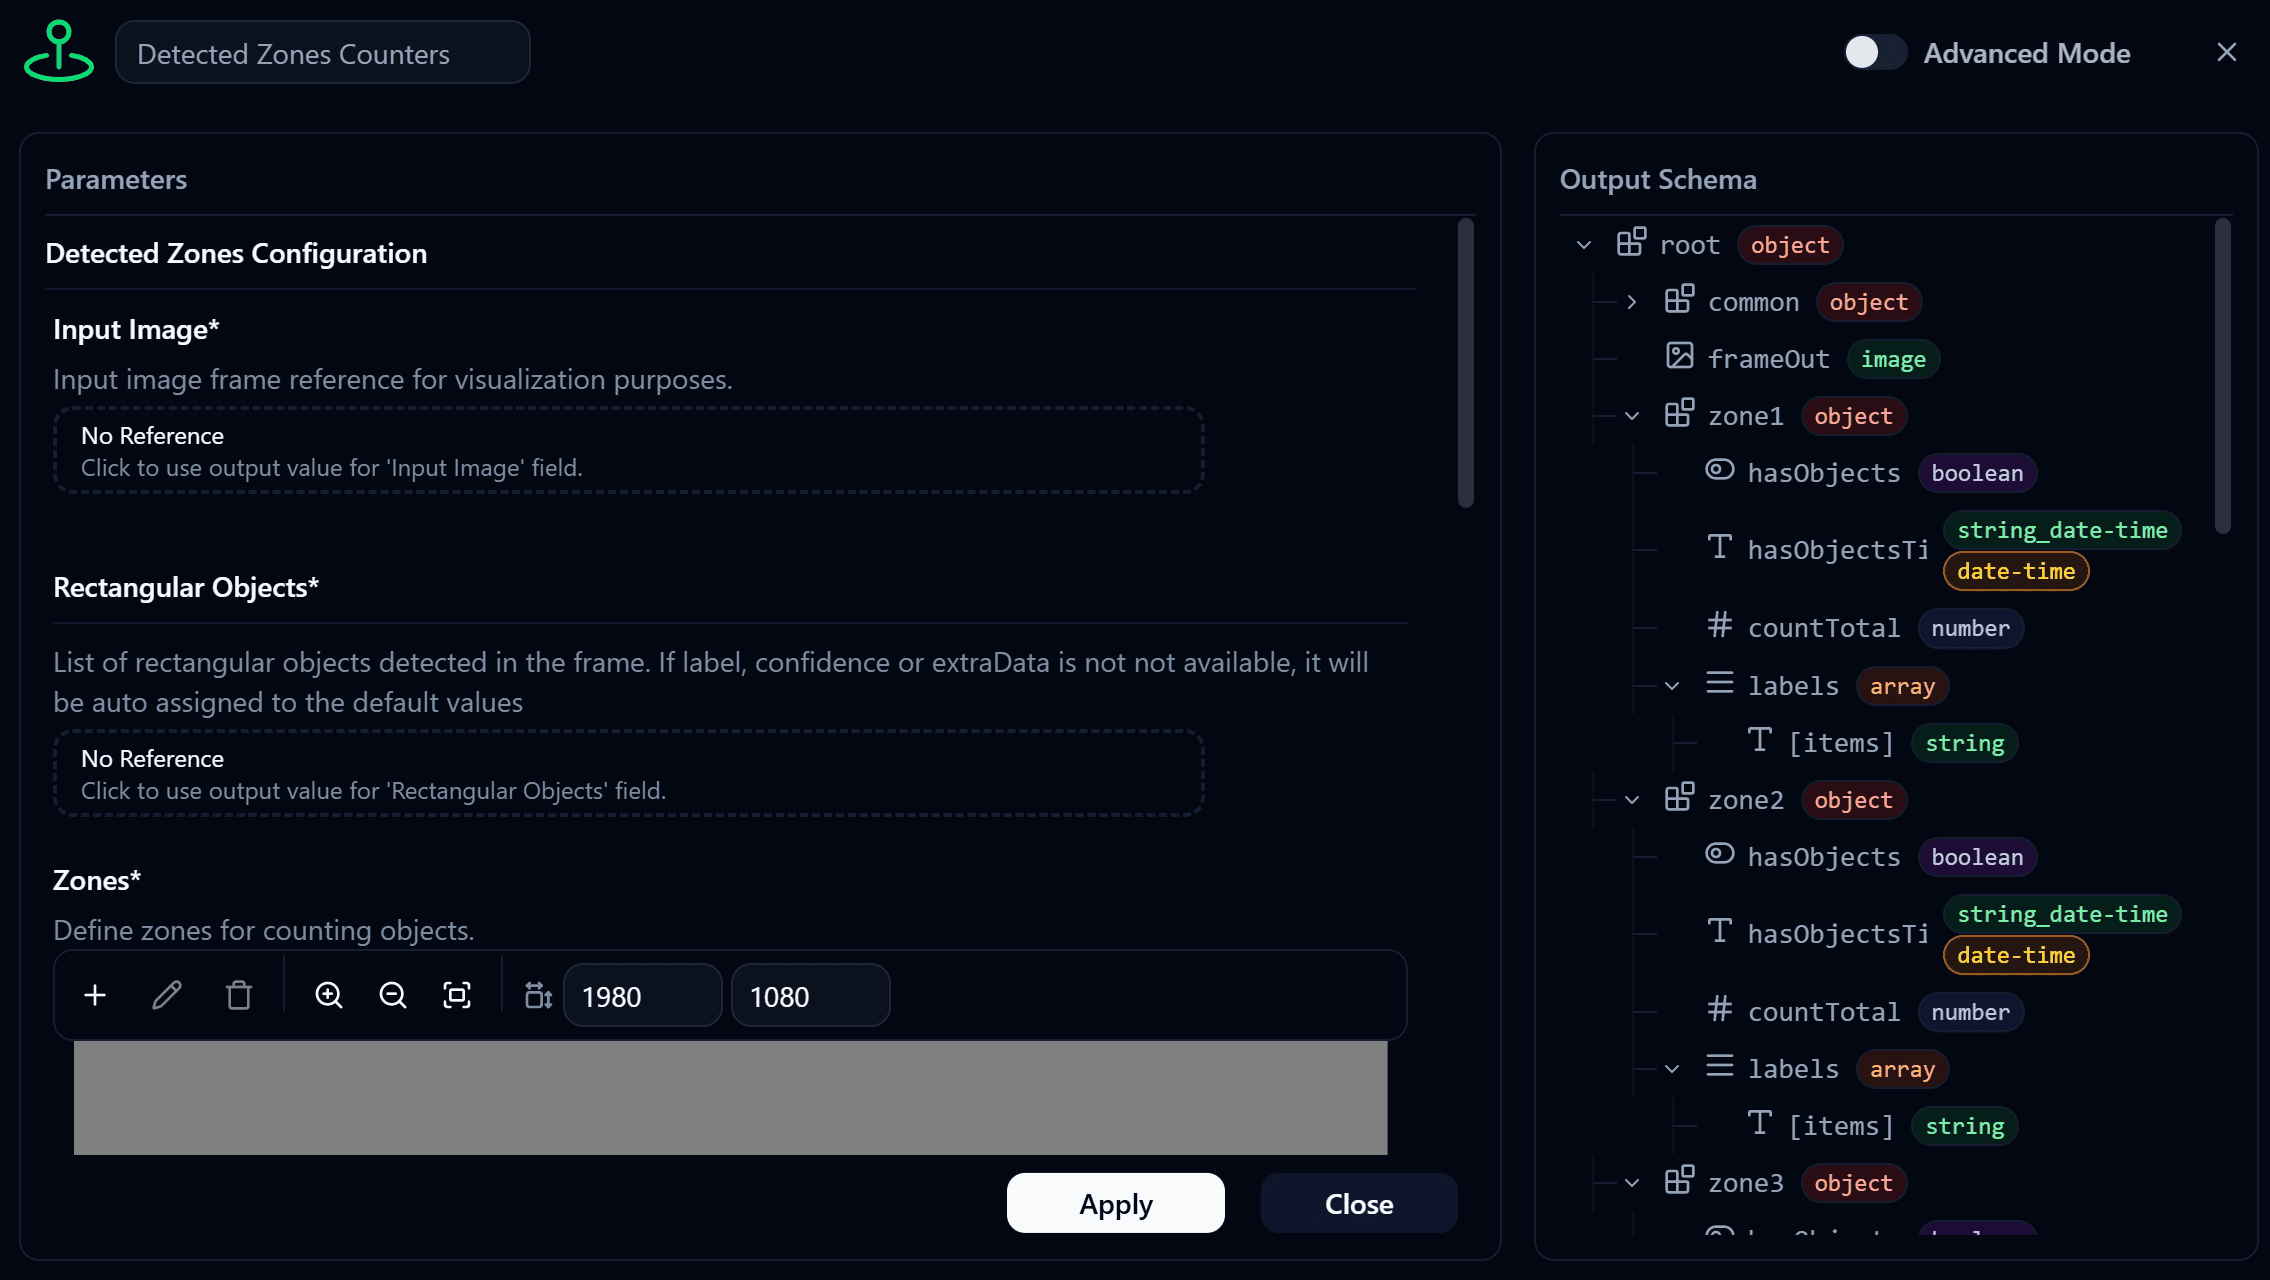
This is what the Node looks like before anything is configured:
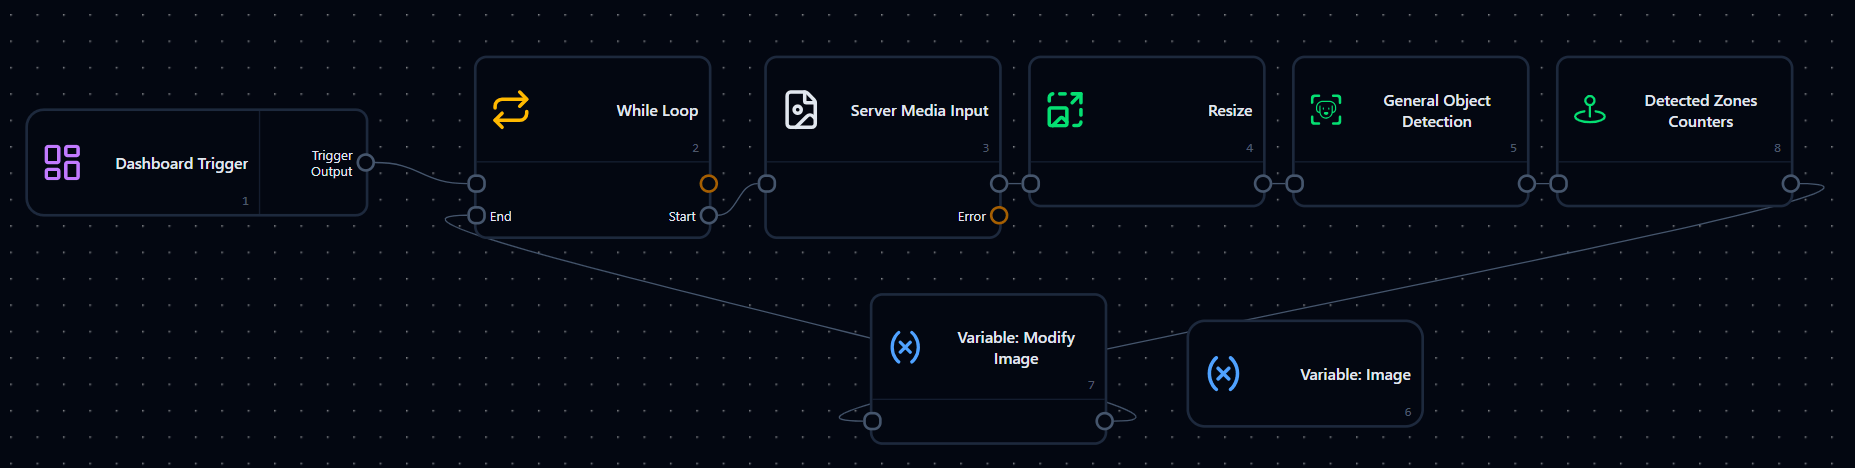
Wire it in and the Flow ends up looking like this:
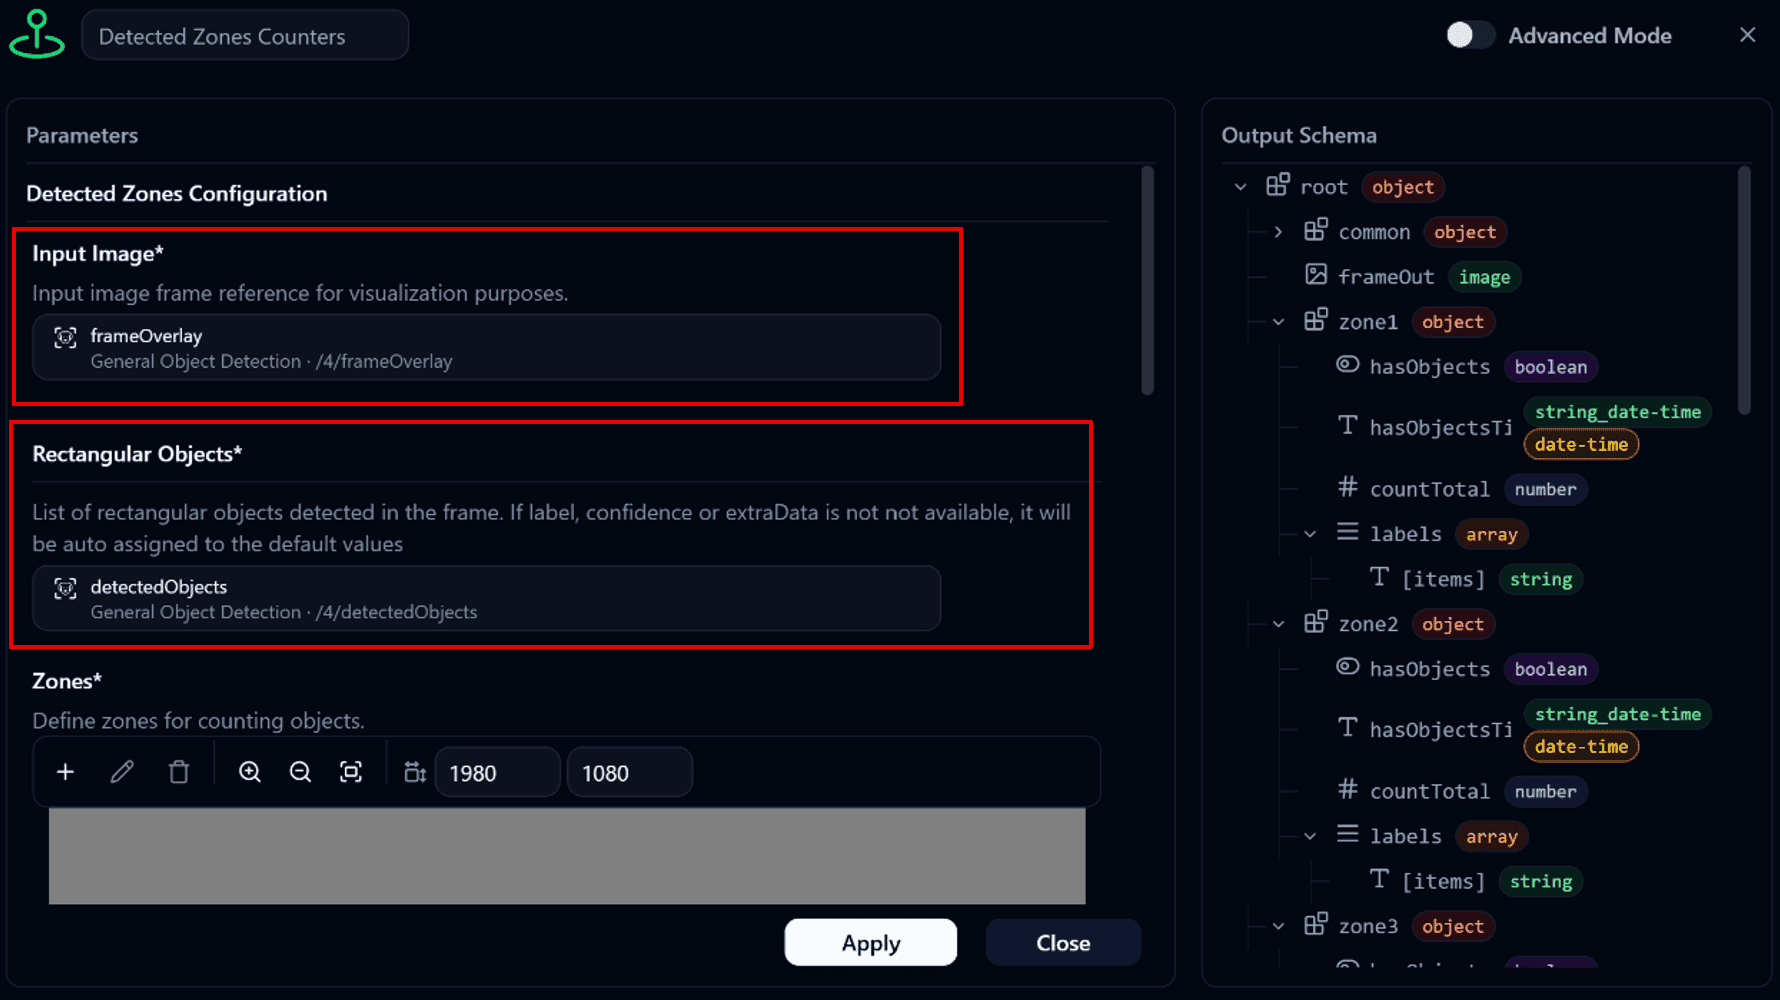
As mentioned earlier, this Node needs both Input Image and Rectangular Objects, and both can reference General Object Detection directly:
| Parameter | Value | Description |
|---|---|---|
| Input Image | frameOverlay from General Object Detection | The picture that already has detection boxes on it, used as the base for drawing zones over |
| Rectangular Objects | detectedObjects from General Object Detection | The list of boxes to compare against the zones |
Part 3 · Draw the zone
Get the image size right first
Before drawing, go to the Dashboard, find the Image Frame Widget showing your video, and press Download at the top right of the Widget. Using that exact frame as the reference image is what keeps the zone lined up with the real picture.
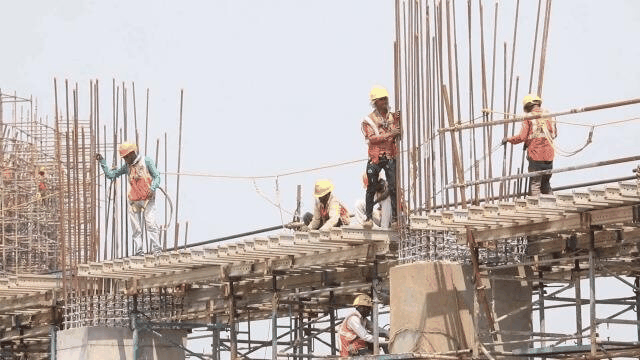
Put the downloaded picture into the Zones section of Detected Zones Counters, in the field marked Drag and drop an image here or click to select a file. Then press + to create a zone. Once you finish drawing, you can pick which zone it should be. One picture can hold several zones.
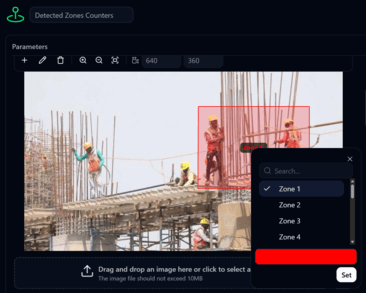
Leave the other settings at their defaults for now. You can come back and change them later.
Deploy and look again. People inside the zone are picked up, and it tells you how many were counted. Here Zone 1 counts 2.
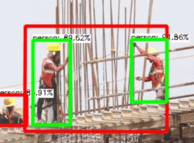
At this point the Detected Zones Counters Flow is working.
Part 4 · Make it do something with the result
Now to make the Flow a bit more capable: count the people in the area and show how many there are, and treat an occupied area as dangerous, worth raising an alert for. If nobody is there, the area counts as safe.
In plain terms: if there is a person in the Danger Area, the status flips to say so and the number of people detected is shown. If not, the status goes back to safe and the count is 0.
We'll use the Variable Nodes created earlier, with Count branching off to Reset Count and Counting. First, set the condition inside If-Then, comparing whether countInside of Zone 1 is greater than 0:
| Parameter | Value | Description |
|---|---|---|
| Data Type | Number | Compare the two sides as numbers |
| Left value | countInside from Detected Zones Counters · zone1 | How many people are in the zone right now |
| Operator | Greater Than (>) | Greater than |
| Right value | 0 | The threshold to judge against |
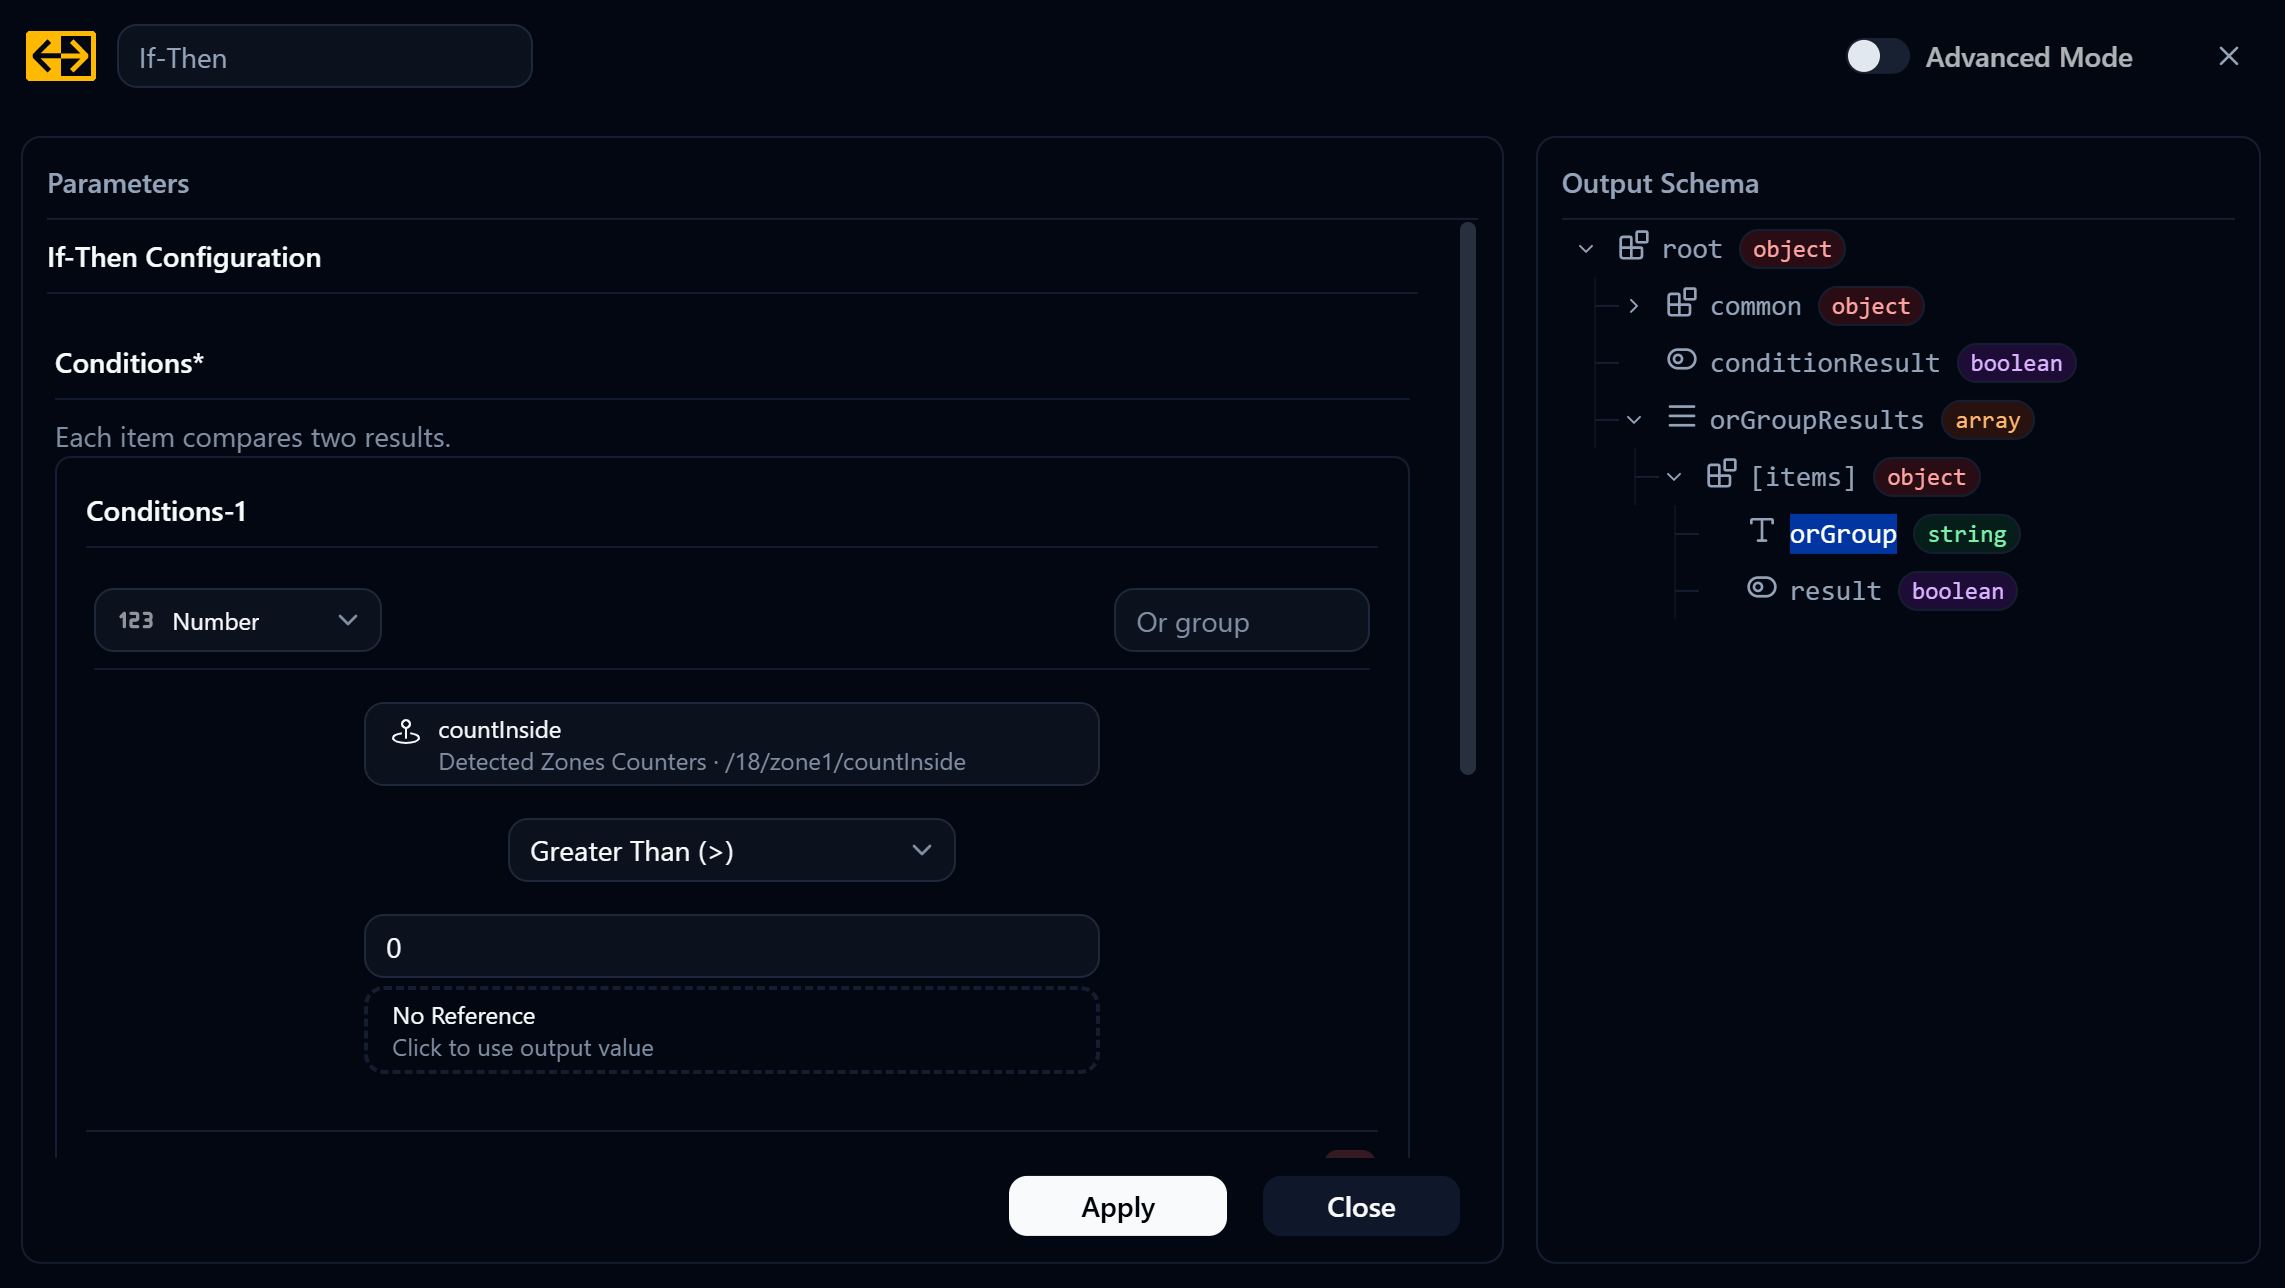
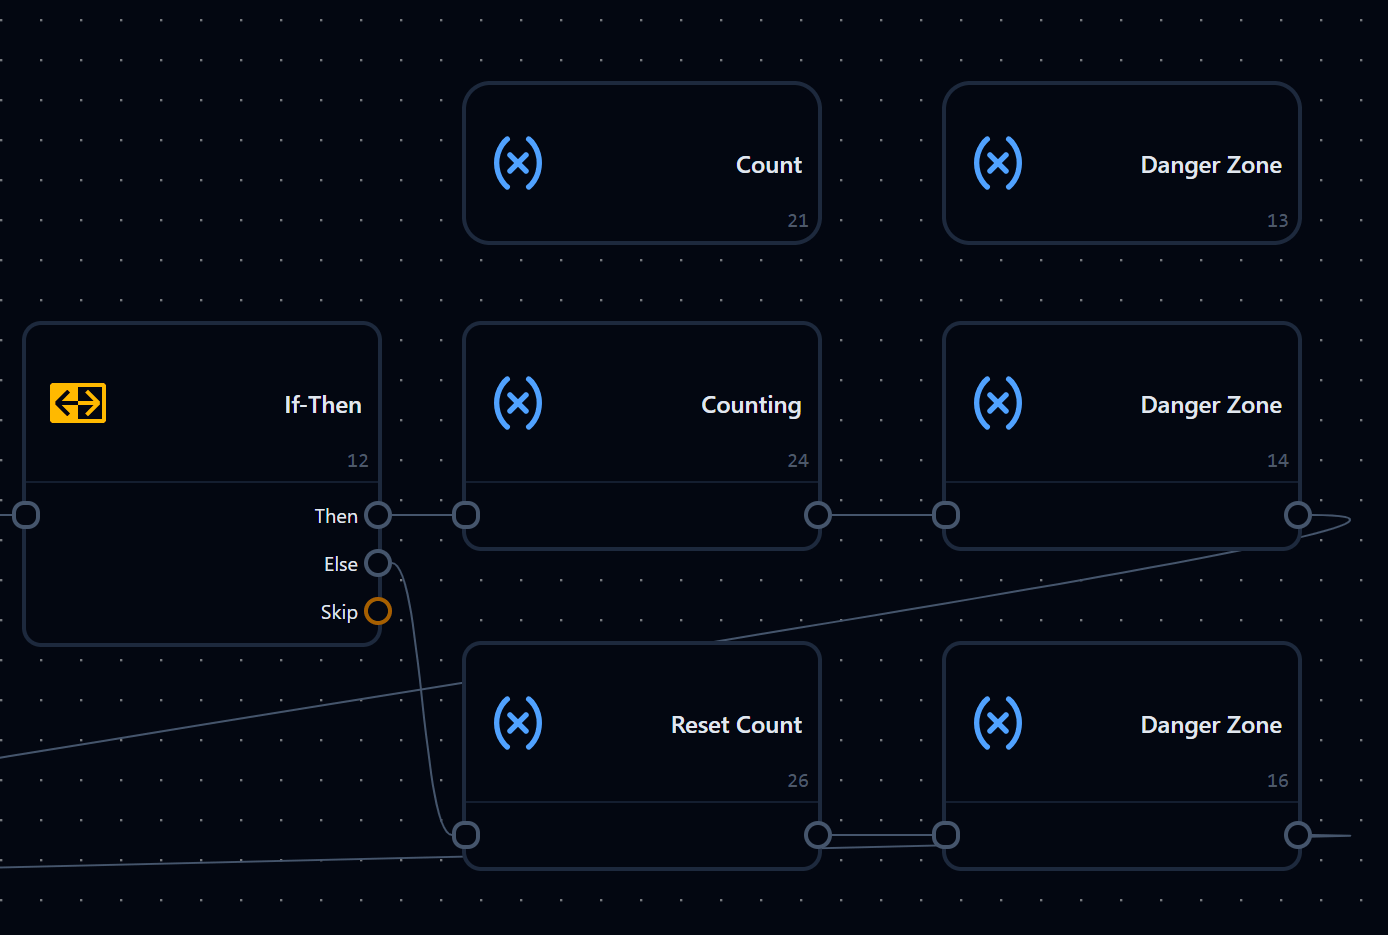
Then wire the branches as shown: countInside > 0 leaves through Then into Counting to record the number of people, and on to the Danger Zone Node set to true. What you do with that status next, whether that is a siren, a notification, or driving some other equipment, is up to you; this example only displays a message for now.
Part 5 · Configure the Variable Nodes
Count Node uses type Number.
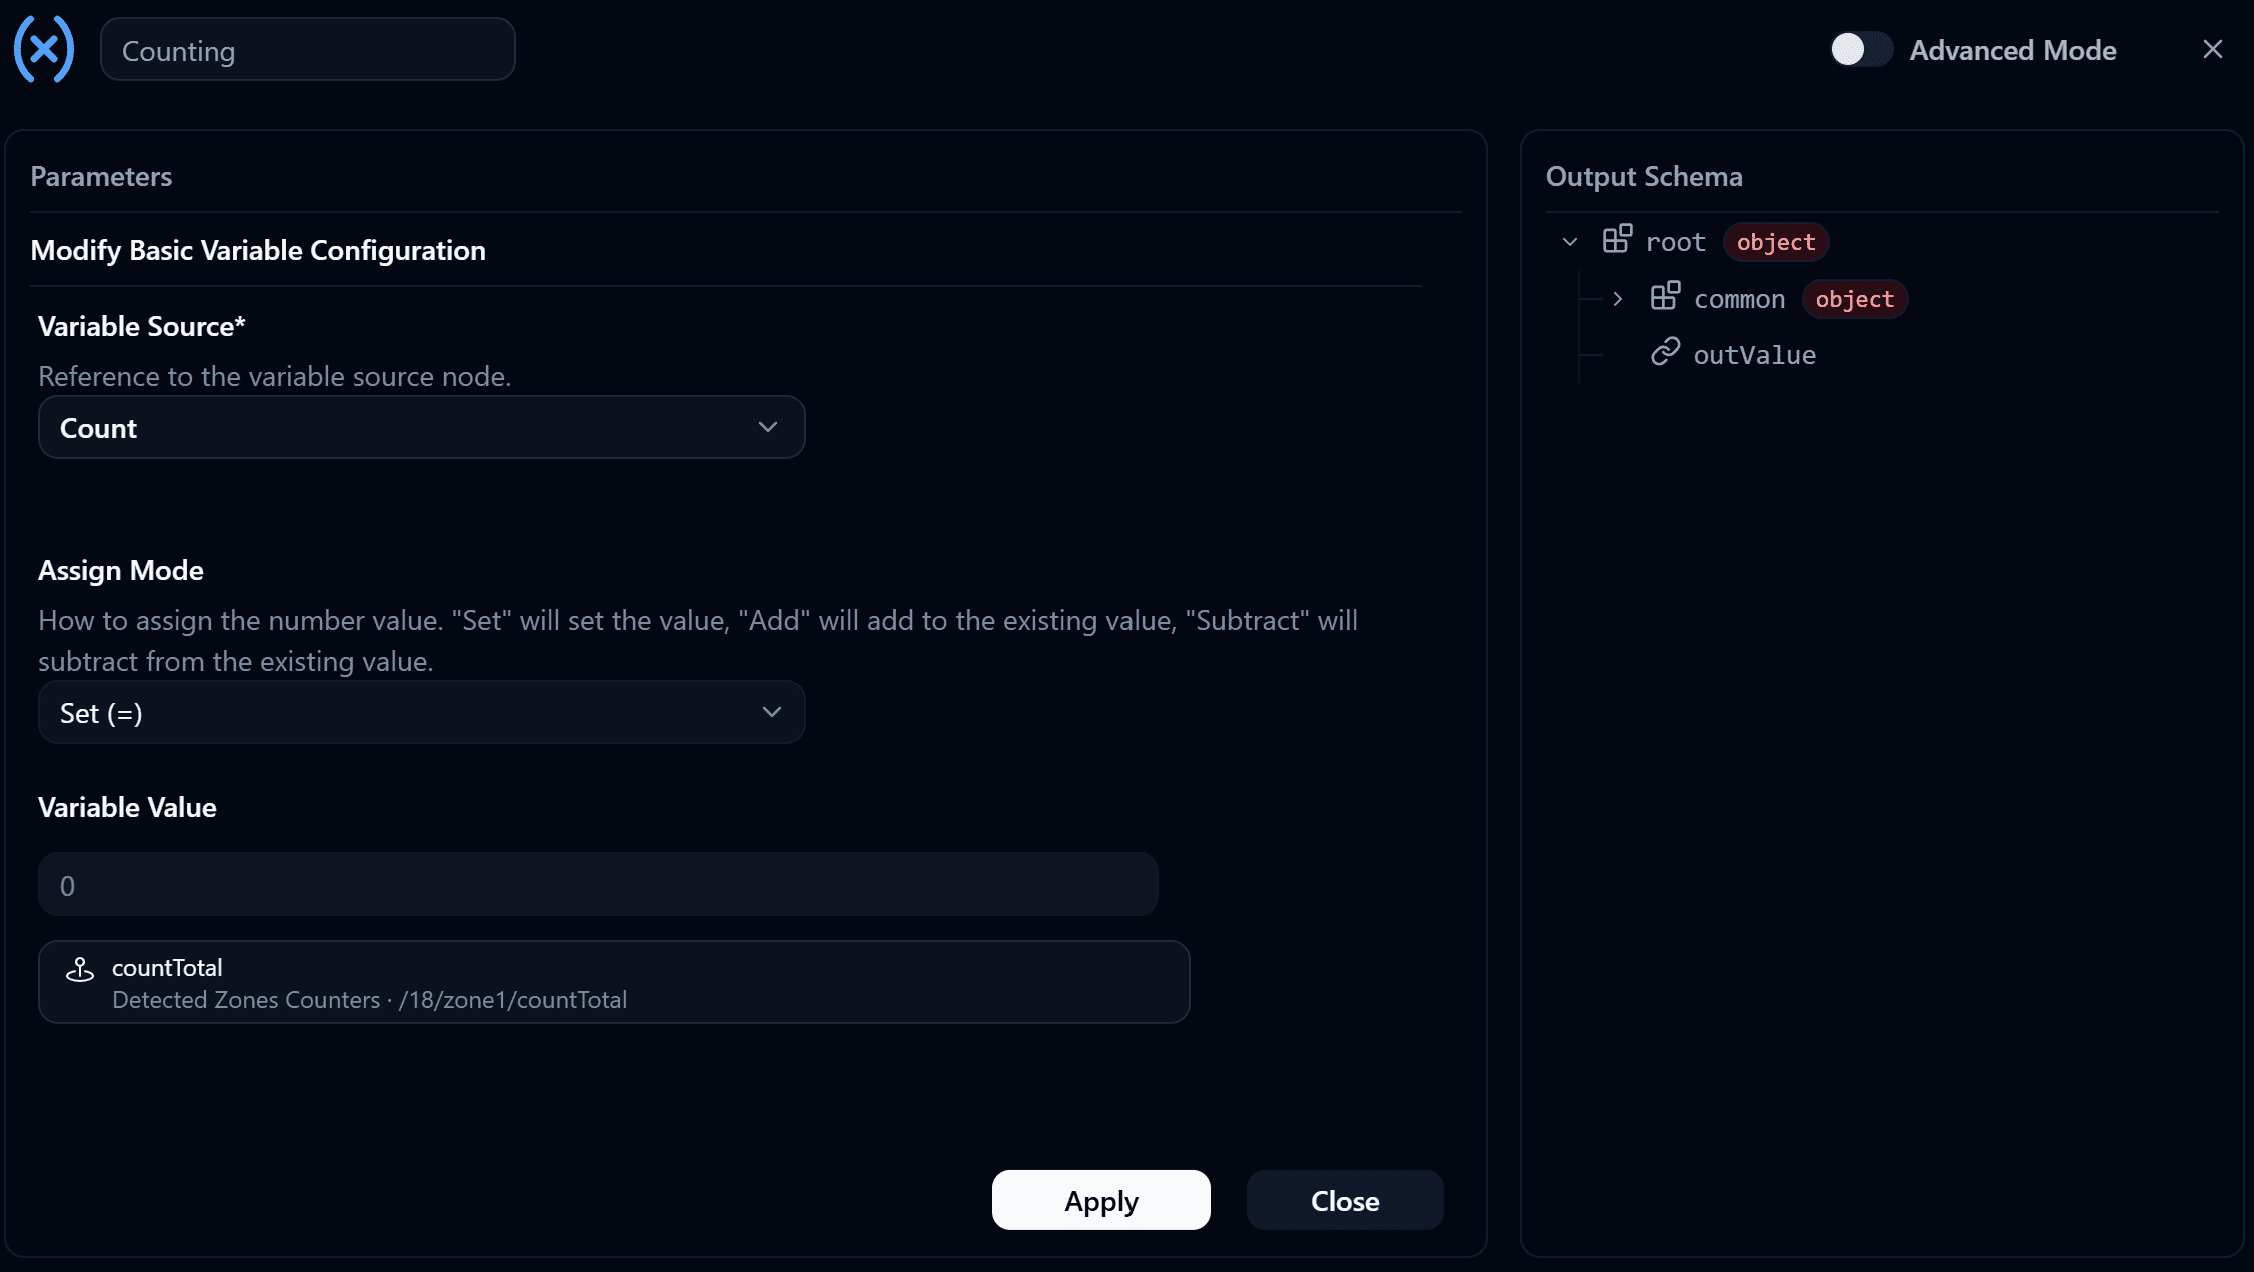
Counting Node
| Parameter | Value | Description |
|---|---|---|
| Variable Source | Count | The variable to write into |
| Assign Mode | Set (=) | Overwrite the old value with the new one |
| Variable Value | countInside from Detected Zones Counters · zone1 | The number of people counted in the zone |
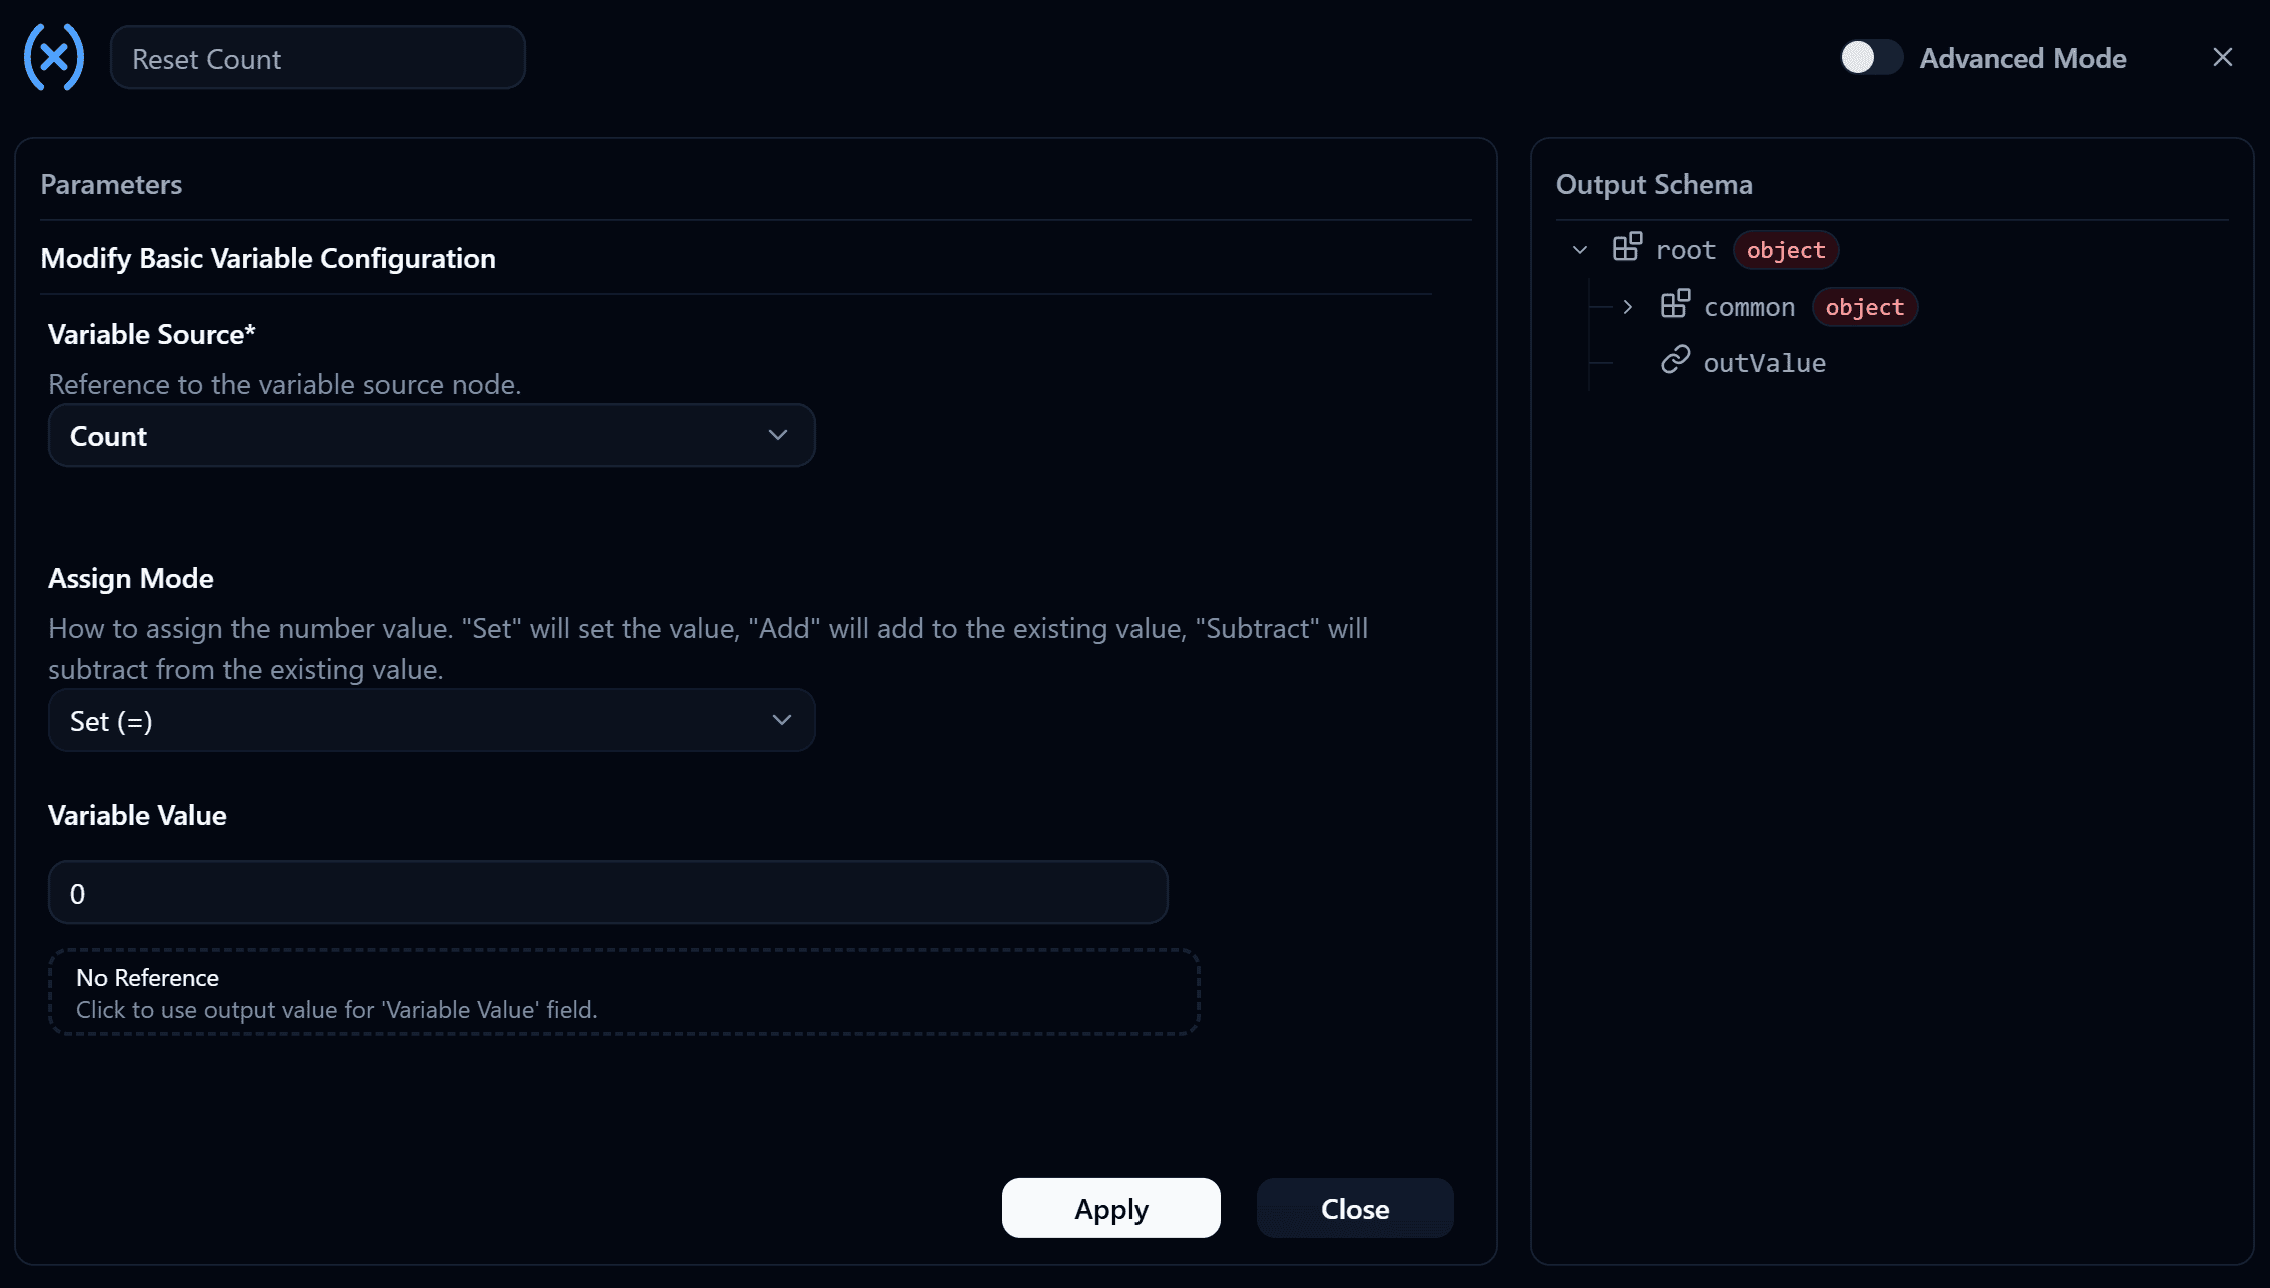
Reset Count Node
| Parameter | Value | Description |
|---|---|---|
| Variable Source | Count | The same variable as Counting |
| Assign Mode | Set (=) | Overwrite the old value |
| Variable Value | 0 | Clear it back to zero once the zone is empty |
Danger Zone Node uses type Boolean.
Two Nodes write into Danger Zone. They are configured identically apart from a single switch.
| Parameter | Value | Description |
|---|---|---|
| Variable Source | Danger Zone | The variable to write into |
| Variable Value | switch on, meaning true | Used on the Then path, when someone is in the zone |
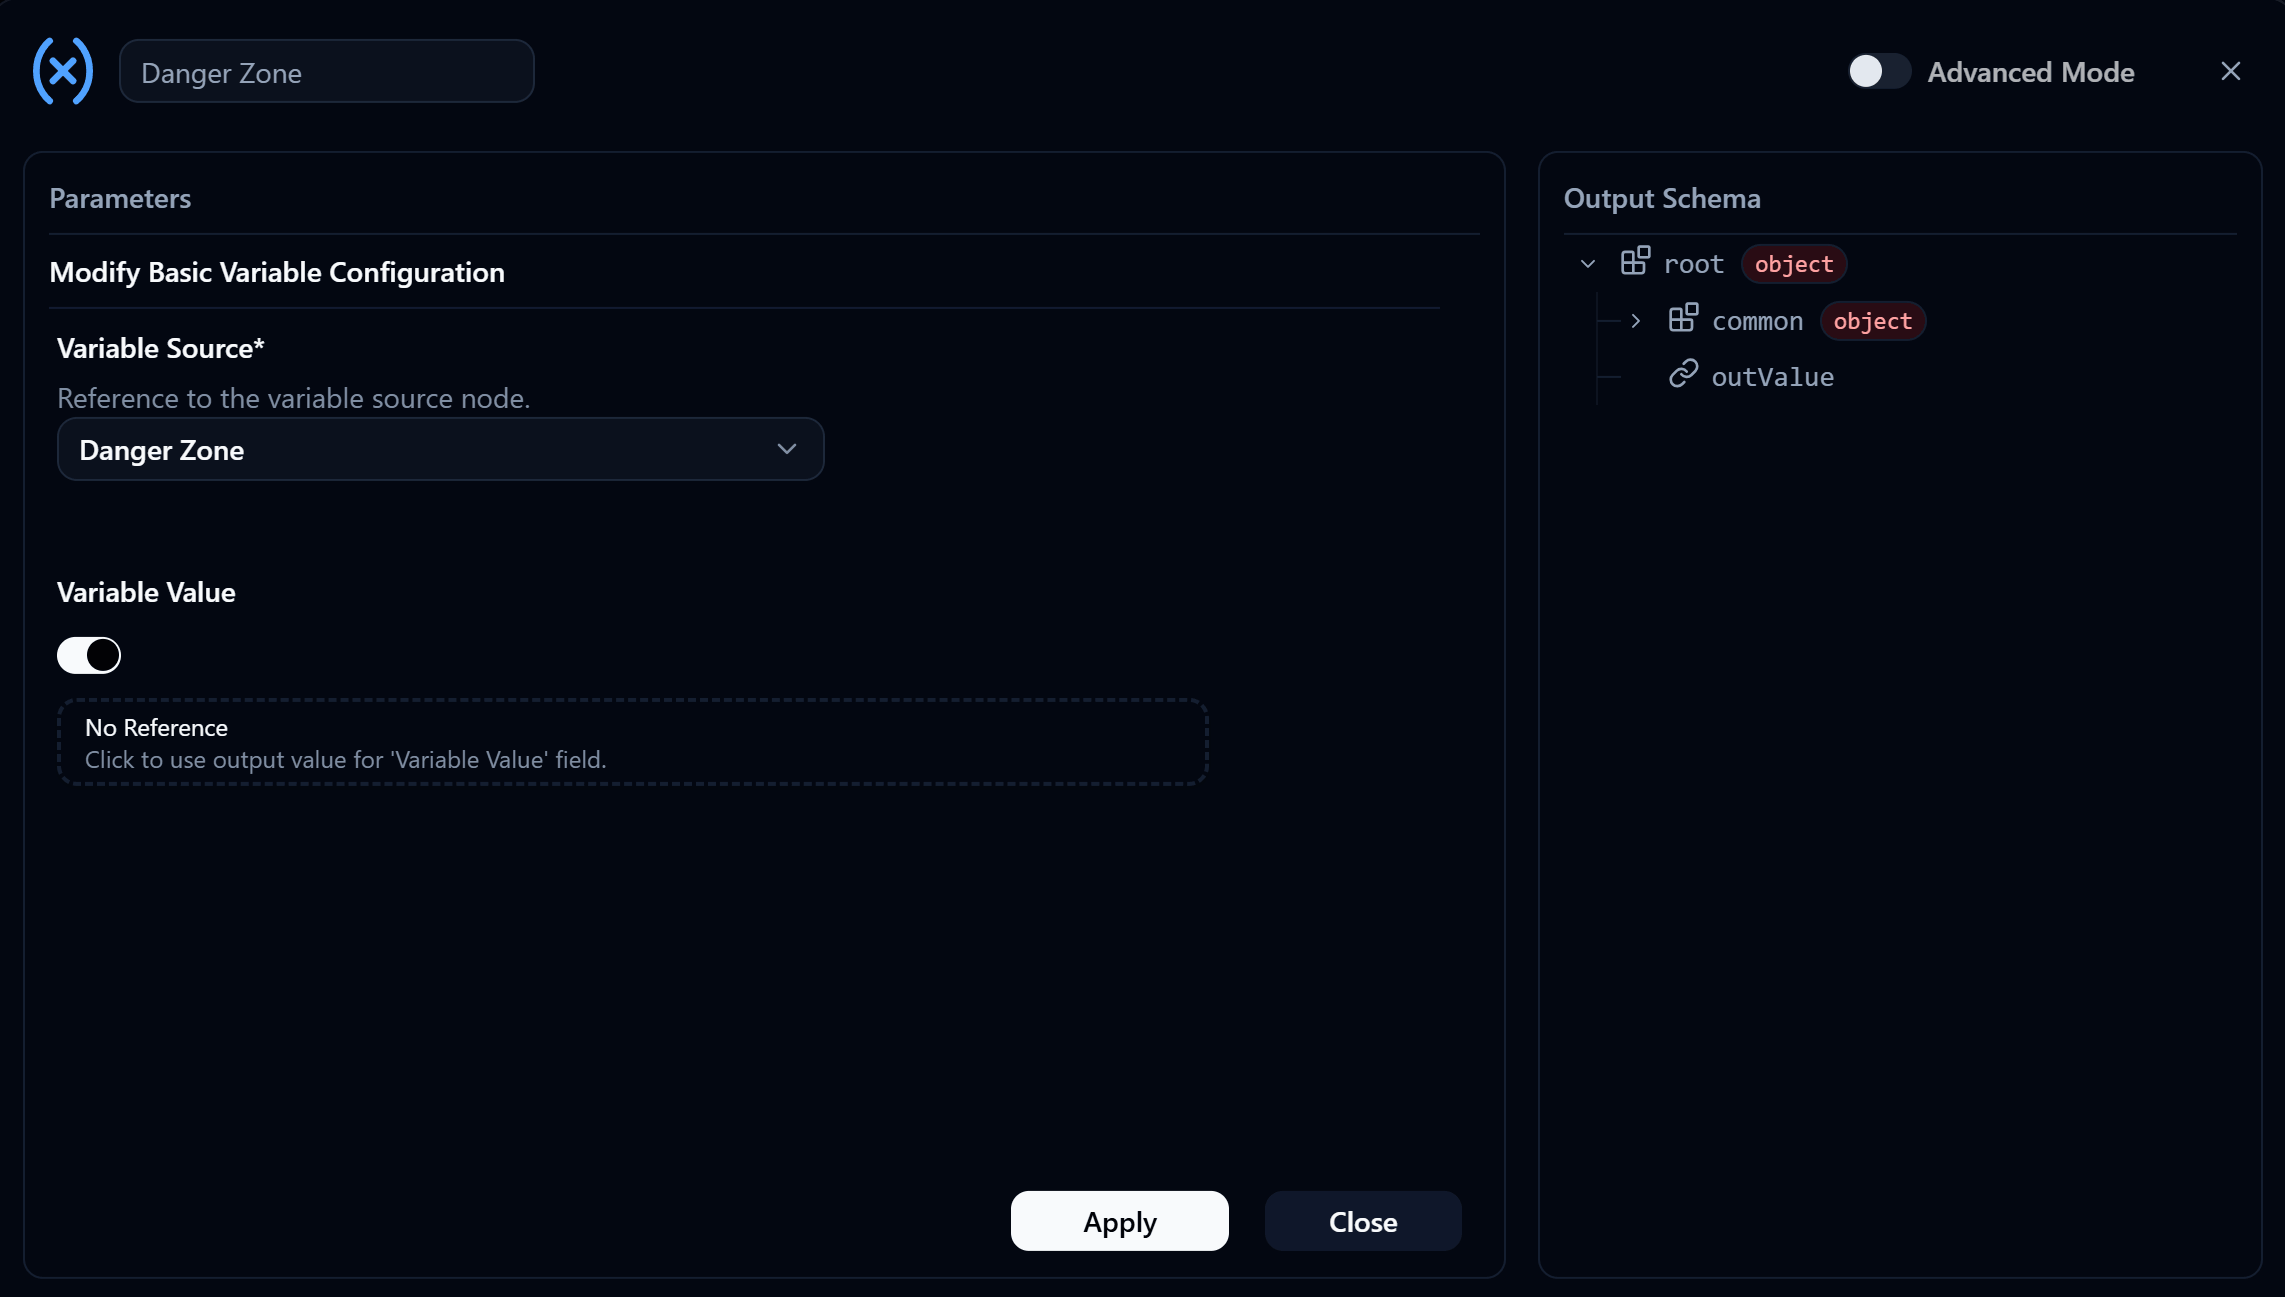
Set the second one up exactly the same way, but leave the Variable Value switch off so it writes false, and wire it to the Else path for when the zone is empty.
Part 6 · Finish the Flow
Wire the Flow together as shown, and remember it has to end at the Loop End, so every path has to lead back to the While Loop's End.
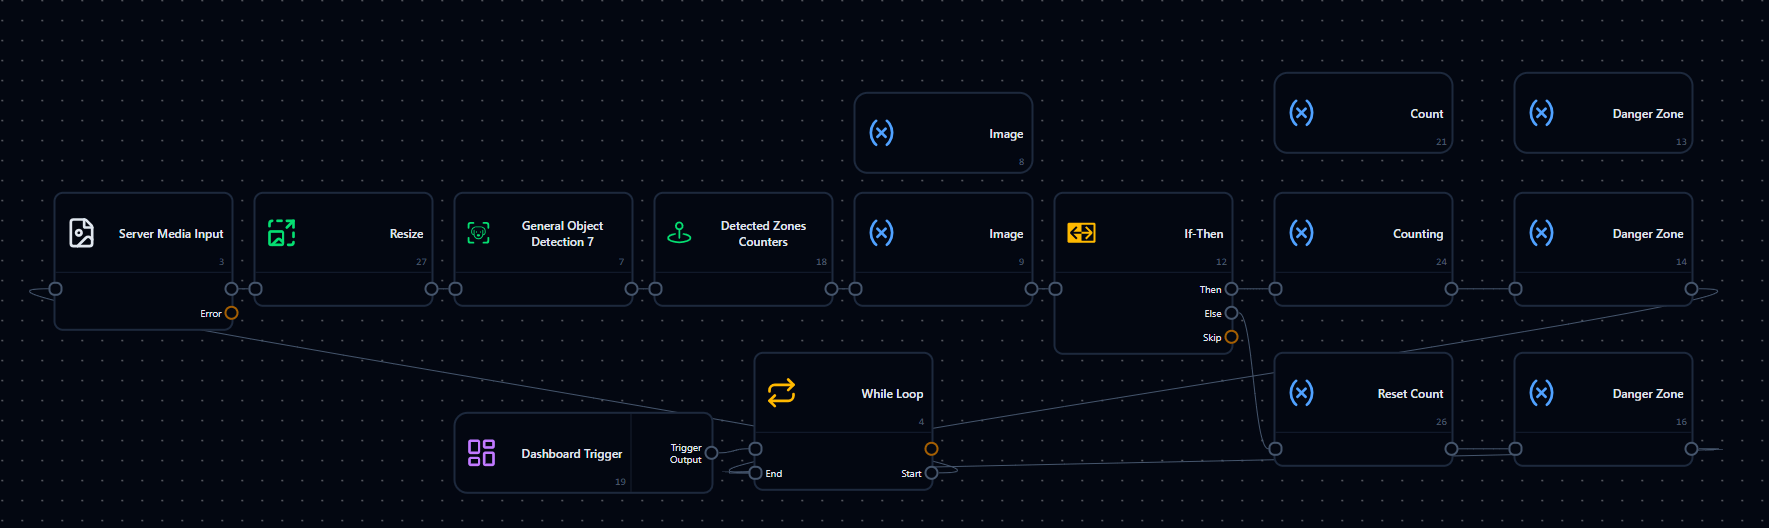
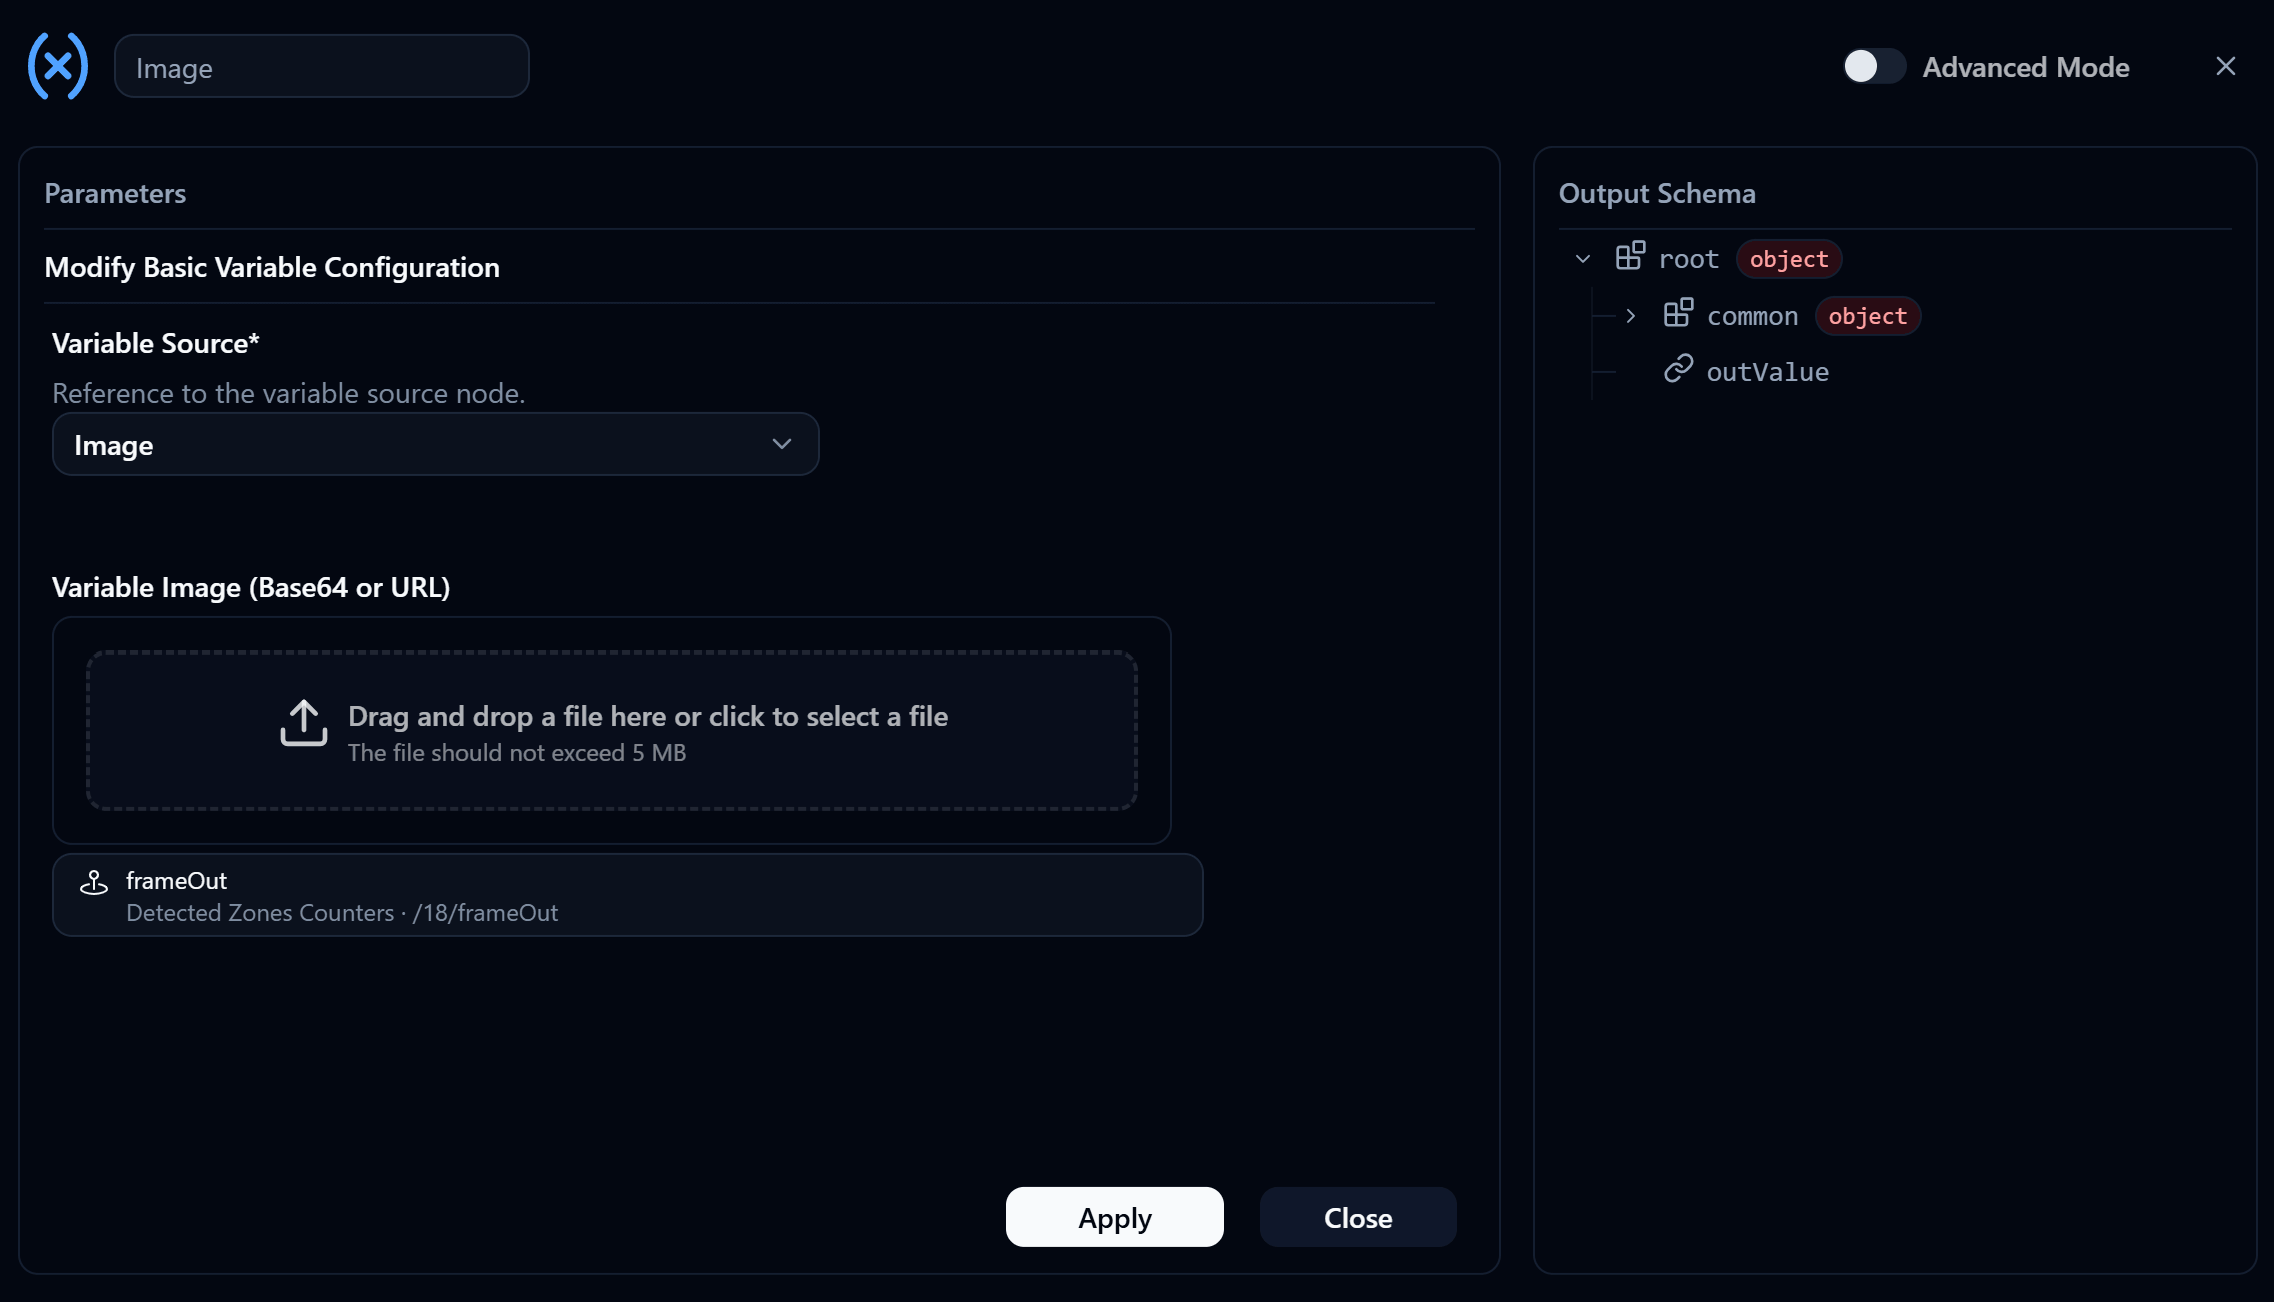
One more thing to go back and fix: Variable Modify Image has to reference Detected Zones Counters as its Source rather than the detection Node, otherwise the zone never shows up on the Dashboard.
| Parameter | Value | Description |
|---|---|---|
| Variable Source | Image | The image variable the Widget reads from |
| Variable Image | frameOut from Detected Zones Counters | The picture that already has both detection boxes and the zone on it |
Part 7 · Lay out the Dashboard
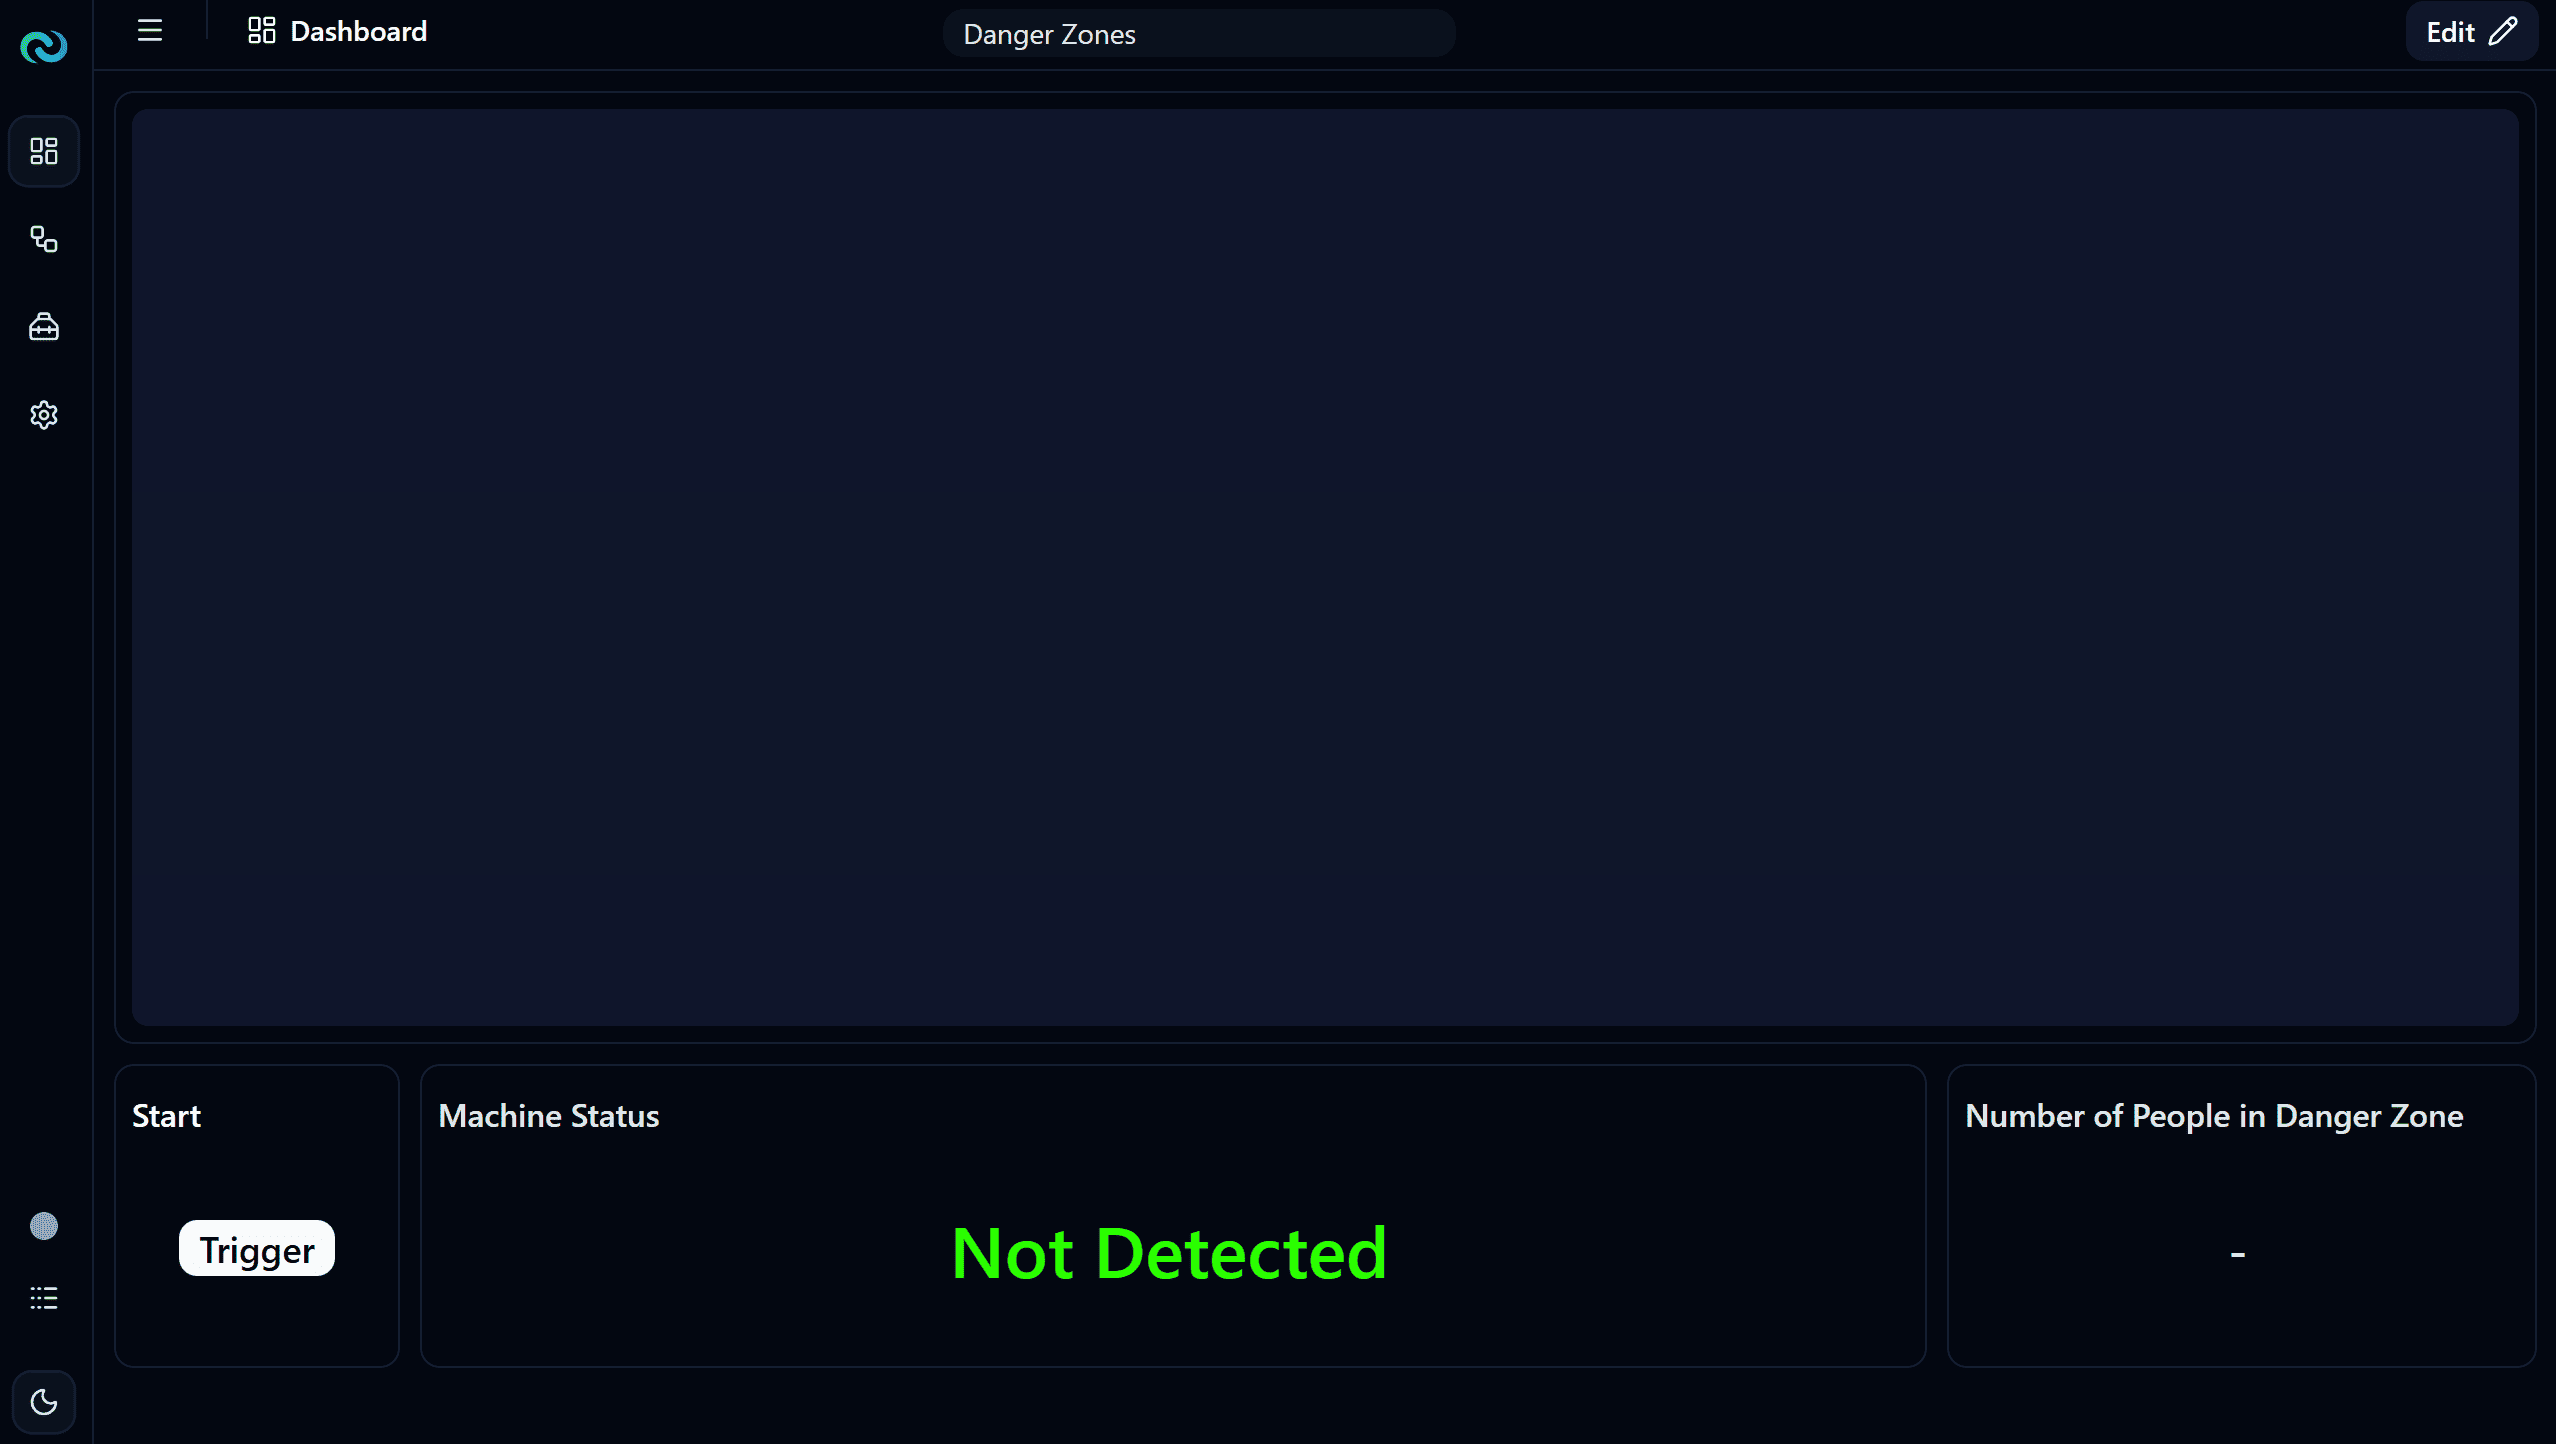
Now build the Dashboard side with the Widgets needed to show the results:
| Widget | Purpose | Variable Source |
|---|---|---|
| Image Frame | Plays the video with the zone and detection boxes | Image |
| Trigger Button | Starts the Flow | - |
| Basic Display | Shows the Danger Zone status | Danger Zone |
| Basic Display | Shows how many people were counted in the zone | Count |
9. Flow Explanation
Once deployed, pressing the Trigger Button enters the While Loop, and one pass through the loop handles exactly one frame.
Server Media Input hands a frame to General Object Detection, which returns the bounding boxes of the people it found. Detected Zones Counters takes those boxes, compares them against Zone 1, and sends out countInside along with a frameOut picture that has the zone drawn on it.
If-Then then reads countInside. Above 0, the Then path writes that number into Count and sets Danger Zone to true. At 0, the Else path resets Count to 0 and sets Danger Zone to false. Either way the path has to end at the While Loop's End before the next pass can begin.
The reason Count and Danger Zone are created once but modified in two places is the same pattern as the Operation chapter: Create declares the variable, and each branch of the condition writes its own value into it.
10. Testing Scenarios
Normal case: Before anyone walks in, the count is 0 and the status reads as working. As people enter the zone, the count moves with however many are inside, and the status flips to stopped. Once they all leave, both values return to their starting state.
Additional test cases:
- Move the zone to a different part of the picture and see whether the count follows the new area
- Change the condition from
countInside > 0tocountInside > 1, so one person still passes but two do not - Draw a second zone and count two areas separately using
zone2 - Change Label names to detect to something else in the footage and see how the count changes
11. Troubleshooting
- The zone sits in the wrong place on the picture: Check that the width and height in the Zones section match the resolution of the video, and that the reference image is the one downloaded from the Image Frame Widget.
- People walk through the zone but the count stays at 0: By default the middle of the bounding box is what decides. A box that only overlaps the edge is not counted until its centre moves inside. Check also that Rectangular Objects really does reference
detectedObjects. - Detection boxes show but the zone does not: Variable Modify Image is still pointing at the detection Node. Change its Source to
frameOutfrom Detected Zones Counters. - The video plays once and freezes: A Node inside the loop is not connected back to the While Loop's End, so the pass never completes.
- The status never changes: Check that the If-Then Data Type is Number, and that Then and Else lead to the right Variable Modify Nodes.
12. Challenges and Summary
Challenge 1: Add a second zone for a different area, such as a walkway, and show its count on the Dashboard alongside the first, using zone2.countInside as the source.
Challenge 2: Use labels instead of countInside so the Flow reacts differently depending on what is in the zone, so a person counts as dangerous while other objects are let through.
Challenge 3: Instead of only displaying a message, drive something outside NARA when someone is in the zone. Mini Project 2 covers watching a value and acting the moment its status changes, and the same condition works just as well for an MQTT message or a Modbus write.
Project Summary: This project connected detection to a decision. The video is read frame by frame, a model finds the objects, Detected Zones Counters narrows the result down to the area we care about, and If-Then turns that into a status the Dashboard can show.
The same structure works for anything defined by an area rather than by the whole picture: counting items at an inspection point, watching a loading bay, or checking whether a walkway is clear.
Ready for the next project?
Now that a Flow can react to what happens inside a zone, continue to Mini Project 2 · Machine Status Monitoring, which turns a changing reading into a status and decides when a machine has to stop.
Part 2 · HTTP Connection · Connecting to an external system
Use HTTP Client, HTTP Request Polling Trigger, and HTTP Client Request to retrieve data from an external server and display it on the Dashboard using a Postman Mock Server.
Mini Project 2 · Machine Status Monitoring
Practice building an Event-driven Flow that reads machine temperature on a schedule, smooths it before deciding anything, sorts it into Normal, Warning and Critical, counts the critical passes until it hits the limit and stops the machine, with a Reset button that only works once the temperature is back to normal.