
Mini Project 3 · Conveyor Parcel Processing
Practice building a Flow that reads conveyor footage, detects parcels, tracks them across frames, counts only when a box crosses a line, then sorts the boxes with a Switch Case before writing them to a database.
1. Overview
Mini Project 1 taught a Flow to react to what is in a given area. This one goes a step further and has the Flow react to an event that happens at a particular moment: the instant a parcel crosses a counting line on a conveyor.
What you'll build is a Flow that reads conveyor footage one frame at a time, puts every frame through Resize so the picture is always the same size, detects boxes with Object Detection, hands them to a Tracker so the system knows where a given box has moved to in the next frame, and lets Tracker Line Count decide whether that box has crossed the counting line yet. When a crossing actually happens, the Flow records the Box_Count for that moment, sorts the box by type with a Switch Case, assigns the matching Handling Type, and writes a row to the Parcel table.
The point to be clear about from the very start is that one row in the database means one box that has crossed the line, not one detection box in one frame. A single parcel can show up in dozens of frames of video. Write to the database on every frame the box is detected in and the table fills up with the same box over and over.
2. Learning Objectives
By the end of this project, the learner will be able to:
- Tell the jobs of Object Detection, Tracker, and Tracker Line Count apart
- Explain why the Tracker has to come before Tracker Line Count
- Place a counting line on the picture, and understand the idea of A → B and B → A directions
- Use If-Then to keep only the passes where a crossing actually happened
- Tell
Box_Count, the value for one crossing moment, apart from the number of detection boxes in a frame - Use a Switch Case to split box types four ways, and give each path its own Handling Type
- Write crossing events to the
Parceltable and show them on the Dashboard
3. Prerequisites
- Completed the basic course and able to build a Flow from scratch (see Build Your First Flow)
- Completed the Operation, since this project uses While Loop, If-Then, and Switch Case all together
- Completed the Database Table topic, since every crossing ends up as a row in a table
- Completed Mini Project 1 · Danger Zone Monitoring, because this one builds on reading video and detecting objects
- A trained box detection model. This example uses a model trained and exported from Reva (see Use Your Own Models)
- A conveyor video file to test with
4. Expected Result
After deploying and pressing the Trigger on the Dashboard, the conveyor video plays with detection boxes, the path each box has travelled, and the counting line drawn over it. Every time a box crosses the line, Box_Count shows a value and the Parcel table gains one new row.
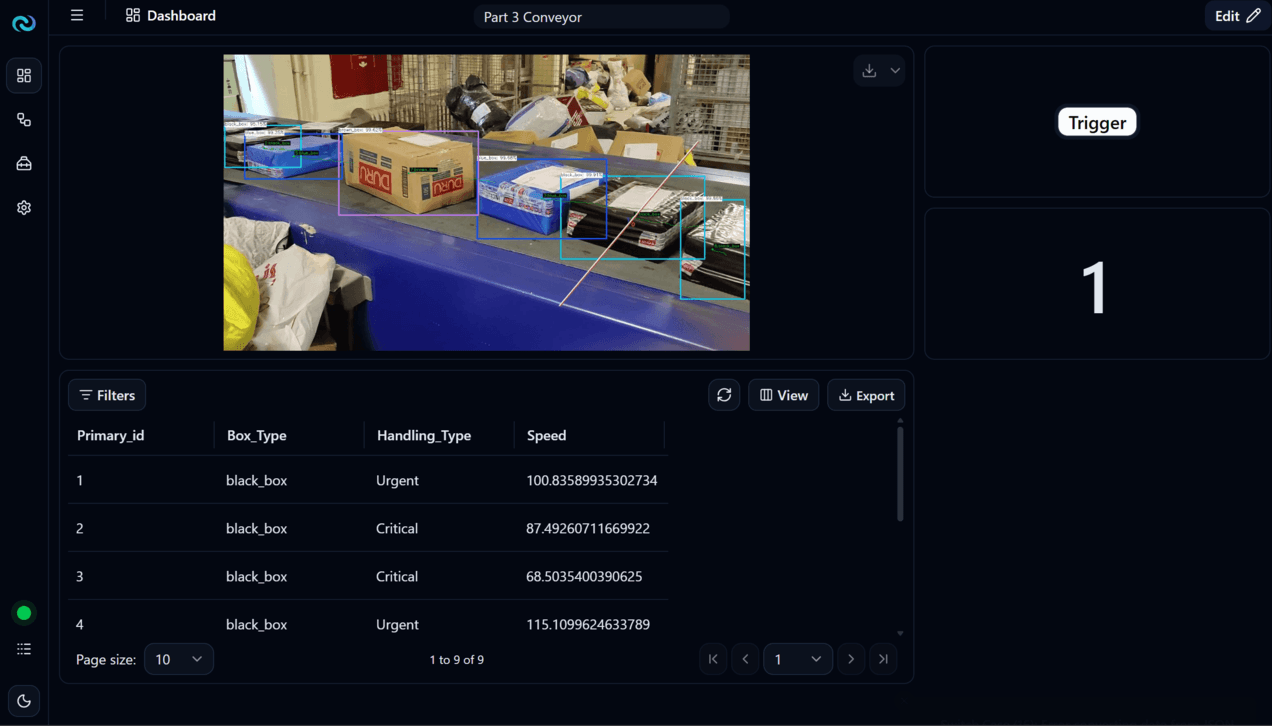
Box_Count is the value for that moment, not a running total. On passes where nothing crosses the line it is 0; it shows a value when a box crosses, then goes back to 0.
0 → 0 → 1 → 0 → 0 → 1 → 0 → ...The Parcel table is where things actually accumulate, since a row that has been written stays in the table for good, and one row means one box that has crossed the line.
5. System Architecture
Everything happens inside NARA. The video is the input; detecting, tracking, and line counting are the processing; and the output goes two ways, to the database and to the Dashboard.
As in Mini Project 1, one pass reads only a single frame, so the whole chain has to sit inside a While Loop.
6. Flow Architecture & Nodes
The Flow uses the Nodes below. Anything that is basic configuration or left at its default is not spelled out again.
| Order | Node | Role |
|---|---|---|
| 1 | Dashboard Trigger | Starts the Flow when the user presses the button on the Dashboard |
| 2 | While Loop | Repeats the pass so every frame gets read |
| 3 | Server Media Input | The conveyor video being run through detection |
| 4 | Resize | Forces the picture to the same size every time before it goes into detection |
| 5 | Object Detection | Detects boxes in each frame using the model trained in Reva |
| 6 | Tracker | Works out whether a box detected in this frame is the same box as in the previous one |
| 7 | Tracker Line Count | Checks whether a box being tracked has crossed the counting line yet |
| 8 | Variable: Create Img | Holds the picture shown on the Dashboard |
| 9 | Variable: Modify Img | Updates that picture on every pass |
| 10 | If-Then | Keeps only the passes where a crossing actually happened |
| 11 | Variable: Create Box_Count | Holds how many boxes crossed the line on that pass |
| 12 | Variable: Modify Box_Count | Writes the counted value into the variable when a crossing happens |
| 13 | Switch Case | Splits the path by box type |
| 14–17 | Variable: Create White / Brown / Black / Blue | The Handling Type for each path |
| 18 | DB Table: Create or Use Parcel | Defines the structure of the Parcel table |
| 19 | DB Table: Row Insert × 4 | Writes to the Parcel table, one Node per Switch Case path |
On the Dashboard side there are five Widgets in total.
- Image Frame × 1, for the video
- Trigger Button × 1, to start the Flow
- Basic Display × 2, for the counted values
- Array Object Table × 1, for the contents of the
Parceltable
7. Key Concepts
The core idea of this project
Detection answers which objects are in this frame. Tracking answers which of them is the same object as before. Line counting answers whether that object has crossed the line yet. Chain the three together and "what appears in the picture" turns into "an event you can record".
Three Nodes, three questions
These three Nodes run one after another and are easy to mix up. The clearest way to keep them apart is to notice that each one answers a different question.
| Node | Answers the question |
|---|---|
| Object Detection | Which objects are in this frame, and where are they? |
| Tracker | Is the object detected in this frame the same one that was detected in the previous frame? |
| Tracker Line Count | Has that tracked object crossed the line you drew? |
Object Detection works on each frame independently. Three boxes in this frame, three boxes in the next one, but the Node itself has no way of knowing whether those are the same three boxes that have moved, or a different set entirely.
Deciding a crossing means comparing where the same object was before and after, and that continuity is what the Tracker adds, so that Tracker Line Count has something to judge the crossing with.
Detection → Tracking → Crossing EventTracker Line Count and the idea of direction
Tracker Line Count works by putting a counting line on the picture first. Tracked objects then move relative to that line, and when the crossing condition is met, the Node sends data out for the rest of the Flow to use.
A line has two sides, so the system splits crossings into A → B and B → A. Separating the directions matters when the real job only wants one of them counted, for example counting only the boxes leaving the production line and ignoring any that get pushed back.
The values this Flow uses from Tracker Line Count:
- countAB number: how many objects crossed in the A → B direction, used as the signal that a crossing happened
- countedObjects array: the list of objects just counted, used to pull details about the box that crossed on that pass, such as
labelandspeed - frameOut image: the picture with the detection boxes, the travel paths, and the counting line already drawn on it, for the Dashboard
One row is one event, not one detection per frame
This is the most important idea in the project.
A single parcel moving past the camera gets picked up by Object Detection in every frame it is still visible in, which can be dozens of frames. Wire Object Detection straight into DB Table: Row Insert and the table gains a new row on every frame, so the same box ends up in the table dozens of times.
What you want is one row per box, only at the moment it crosses the line.
The Node that does the filtering is If-Then, placed after Tracker Line Count.
What Box_Count is, and what it isn't
Box_Count is the number of boxes Tracker Line Count counted on that particular pass. On a pass where nothing crosses, the value is 0, and a value only appears on passes where a crossing actually happened.
- It is not a running total of every box that has ever crossed the line. For that you need a separate variable of your own.
- It is not the number of bounding boxes visible in the current frame. A box still in the picture but not yet across the line is not counted.
The real running total lives in the Parcel table
Because Box_Count goes back to 0 whenever there is no crossing, the data that actually accumulates is in the Parcel table, which keeps every row ever written. A total for a shift should come from the number of rows in that table, not from the value on the Widget.
Why a Switch Case instead of If-Then
If-Then suits a condition with two outcomes, true or false. But there are four box types in this project, so doing it with If-Then means nesting three levels deep, which is hard to read and harder to change later.
A Switch Case takes one value, compares it against several Cases, and splits the path inside a single Node, which fits this kind of problem much better.
All four paths write to the same Parcel table. The only difference is the Handling Type that goes along with the row.
8. Guided Workshop
Part 1 · Read the video, detect, track, and count the line
Start by laying out the main chain, from the Dashboard Trigger all the way to Tracker Line Count. As in Mini Project 1, the While Loop needs its End as well, otherwise the pass never completes.

Node · While Loop
Nothing to configure yet. Leave Loop Delay at 0 for now and adjust it later.
Node · Server Media Input
Point it at the conveyor video you want to run detection on.
Node · Resize
Put Resize in between Server Media Input and Object Detection so the picture going into detection is always the same size.
| Parameter | Value | Description |
|---|---|---|
| Input Image | frameOut from Server Media Input | The source picture from the video |
| Size | [1920, 1080] | The target size. It has to be the same numbers used when placing the counting line in the next section |
Why resize before detecting
Different cameras and different video files give pictures at different resolutions. Let pictures of varying sizes go straight into detection and the counting line lands in the wrong place as the size changes. Normalising the size first means the same Flow works with a different camera without having to redraw the line.
Node · Object Detection
This project uses a model trained and exported from Reva, since parcels sorted by colour are not in any off-the-shelf model.
| Parameter | Value | Description |
|---|---|---|
| Input Image | frameOut from Resize | The resized picture, not the original from Server Media Input |
| Model Directory Path | The model folder exported from Reva | The model that knows all four box types |
If you don't have a model like that yet, this is a good excuse to train one. The parcels here are ordinary cardboard boxes in four colours, which makes a small, forgiving first dataset: a few dozen annotated frames from your own footage is usually enough to get detection working well enough to follow the rest of the chapter.
The route through Reva is three steps:
| Step | What you do | Where it's covered |
|---|---|---|
| 1 | Collect frames, draw bounding boxes, and label each box type | Create Your First Dataset |
| 2 | Create a training project and run the experiment | Train Your First Model |
| 3 | Export the trained weights and copy the Weight Path | Export Trained Model |
That Weight Path is exactly what goes into Model Directory Path here. Bringing an exported model across into a NARA Flow is covered in Use Your Own Models.
Your labels become your Case values
Object Detection sends each class name from Reva through the Flow as label. Switch Case must match that label exactly. In this project, define the names as white_box, brown_box, black_box, and blue_box, then use them consistently. Renaming a class later requires updating every corresponding Case.
Node · Tracker
Put the Tracker after Object Detection, referencing the picture and the detected object list from Object Detection. The rest of the settings can stay at their defaults for now.
The Tracker on its own produces no count
All the Tracker does is keep objects continuous from frame to frame so the next Node has something to work with. The actual counting happens at Tracker Line Count.
Node · Tracker Line Count
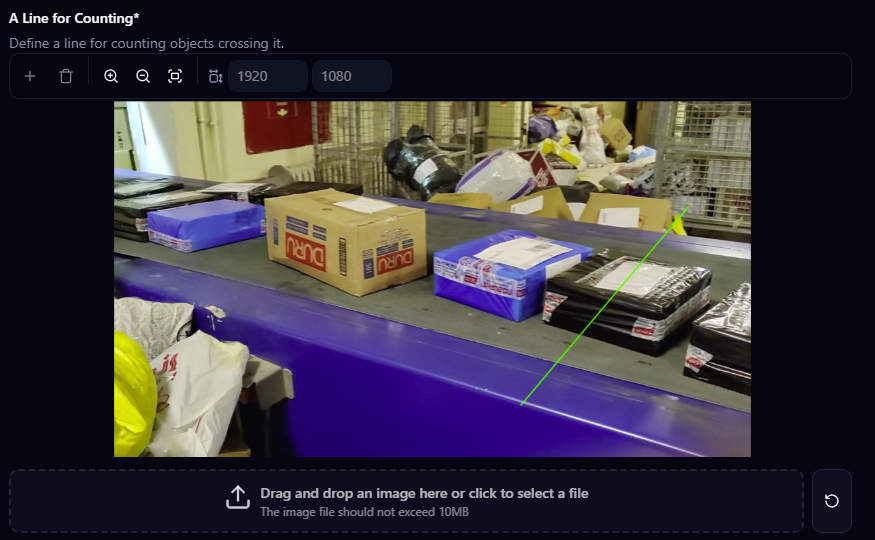
Put Tracker Line Count after the Tracker, then set the counting line under A Line for Counting: upload a reference picture, press +, and drag a line where you want the counting to happen. The width and height at the top (1920 × 1080 here) have to match the size of the picture actually being processed.
Use the real picture as your reference
Just like setting the zone in Mini Project 1, before placing the line it helps to go to the Dashboard, select the Image Frame Widget showing the video, and press Download in its top right corner, so the line lines up with the real picture.
Where you put the line directly affects the result. Place it somewhere the whole box passes through, and keep it away from the edge of the frame, or boxes will cross it the moment they appear.
Part 2 · Show the picture on the Dashboard and filter events with If-Then
This step adds two things at once: the image variable for the Dashboard, and the filter for crossing events.
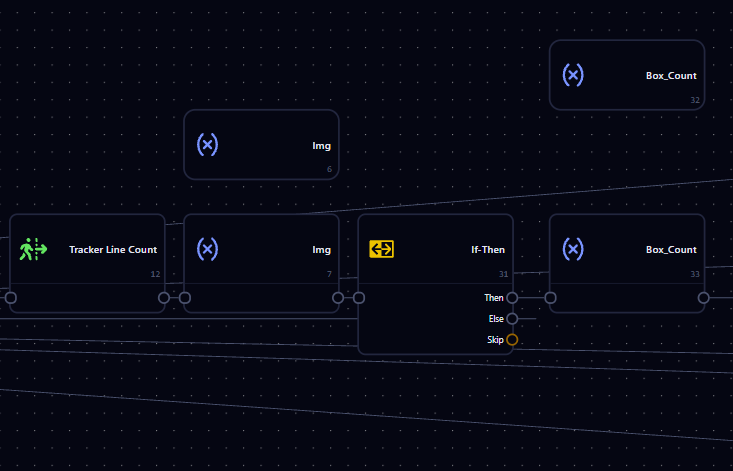
Create a Variable: Create called Img of type image, then use Variable: Modify to write the picture into it on every pass.
| Parameter | Value | Description |
|---|---|---|
| Variable Source | Img | The image variable the Widget reads from |
| Variable Image | frameOut from Tracker Line Count | The picture that already has the detection boxes, the travel paths, and the counting line on it |
Always reference the picture from the last Node in the chain
If Variable Modify still references the picture from Object Detection, the Dashboard shows the detection boxes but no counting line. Switch it to the picture from Tracker Line Count, which already has the line drawn on.
Next, put an If-Then after Tracker Line Count to check whether a box actually crossed on this pass, by testing whether countAB is greater than 0.
| Parameter | Value | Description |
|---|---|---|
| Data Type | Number | Compare the values as numbers |
| Left value | countAB from Tracker Line Count | How many boxes crossed on that pass |
| Comparator | Greater Than (>) | Greater than |
| Right value | 0 | The threshold for the decision |
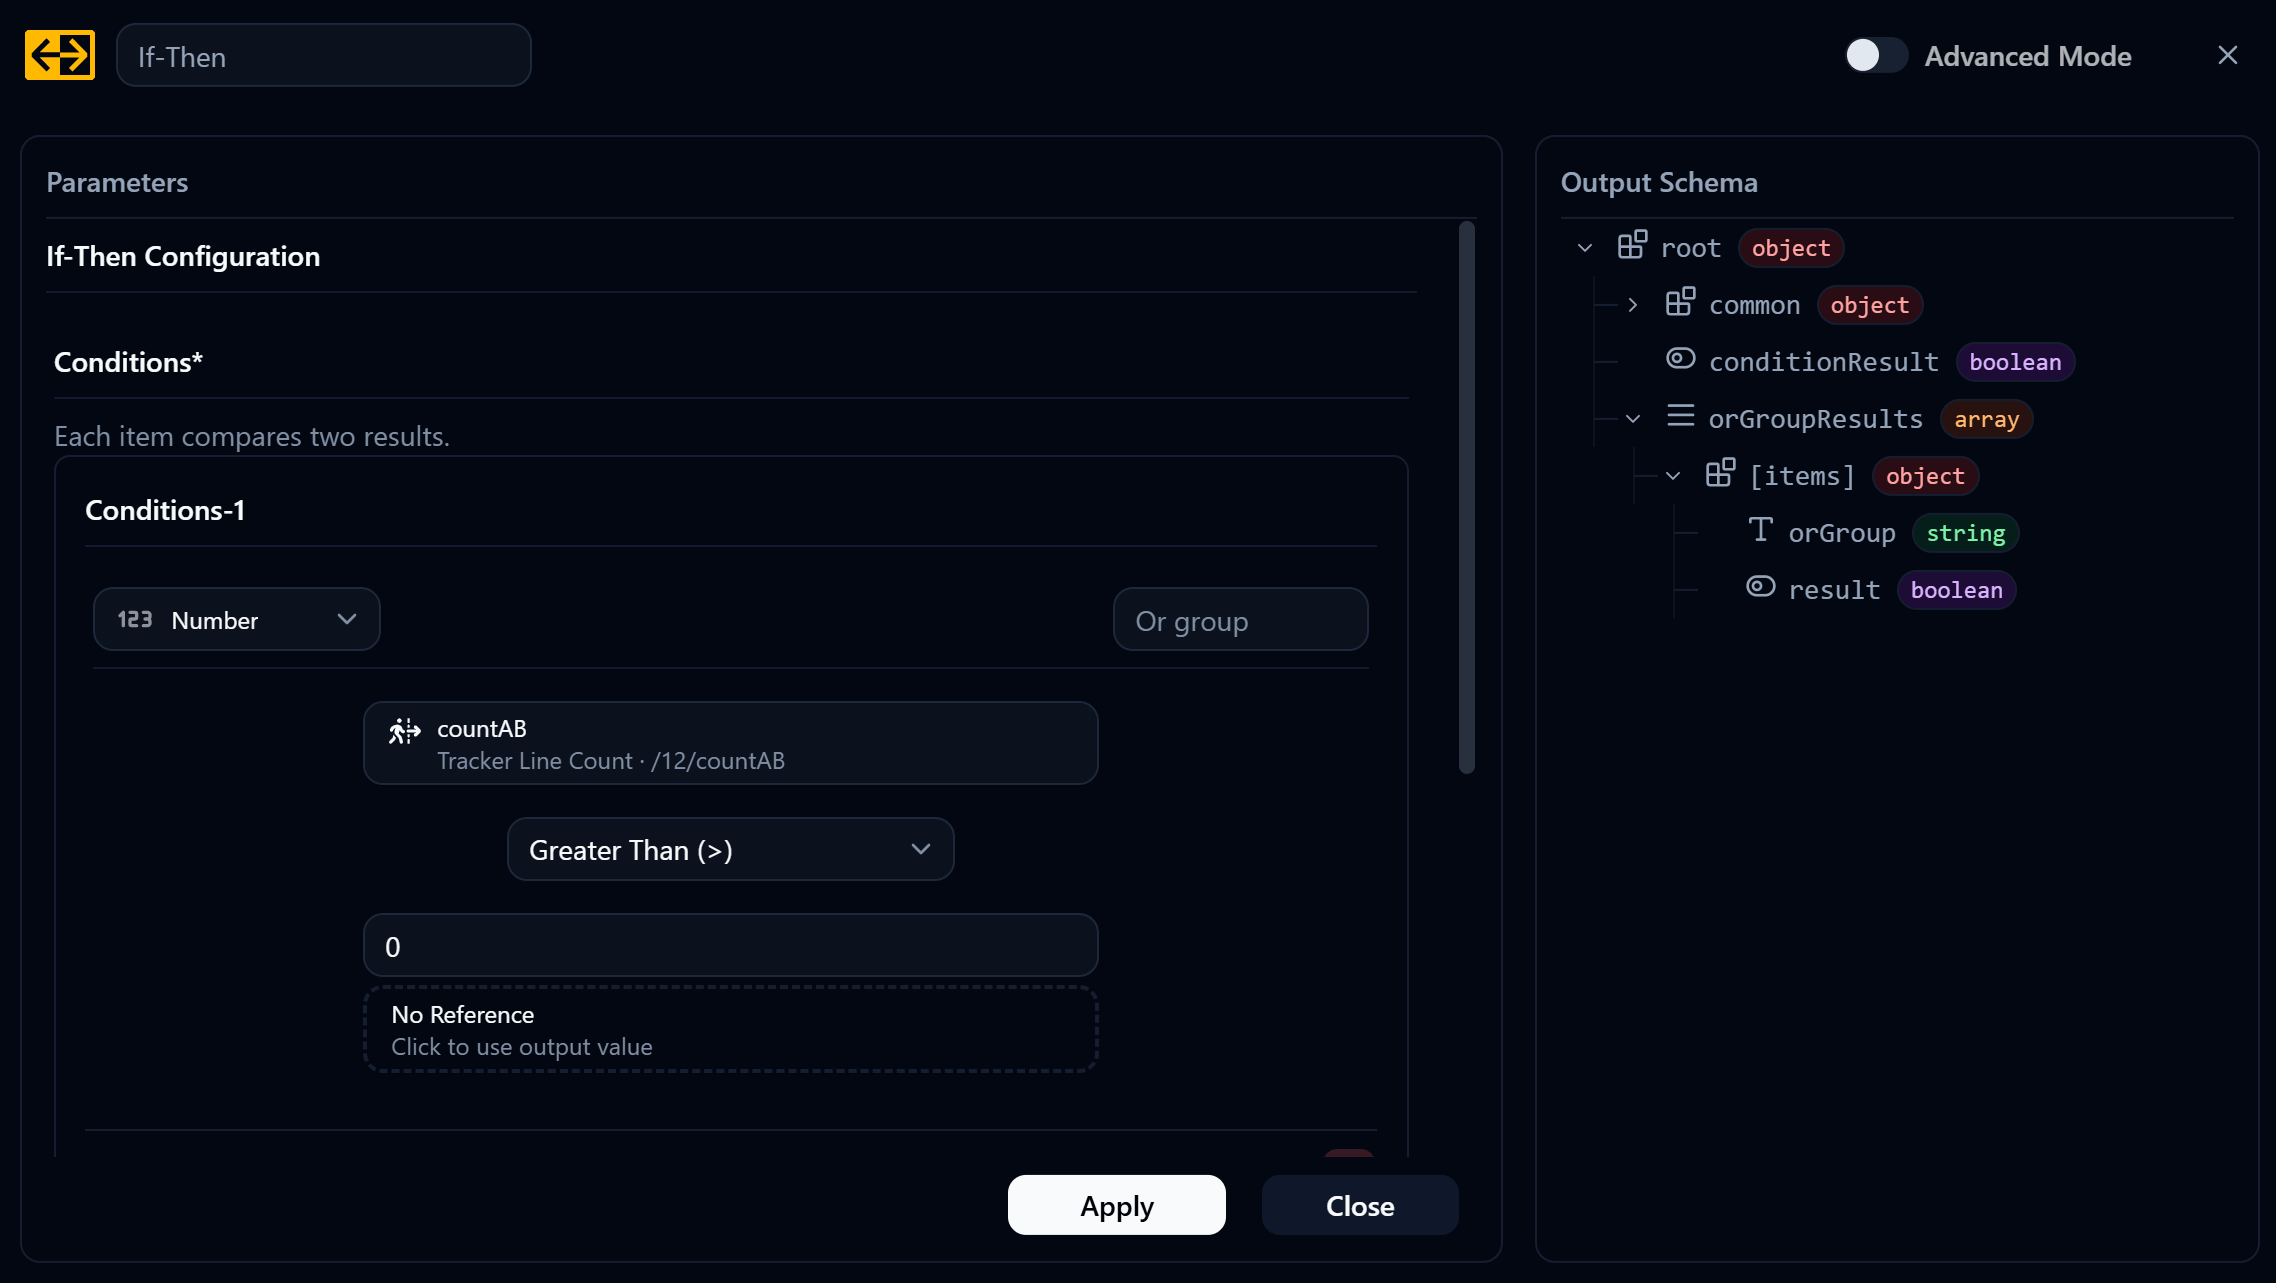
As an idea, it comes down to this:
No new crossing   →  no new row in the Parcel table
A new crossing    →  carry on to Box_Count → Switch Case → Database
Off the Then branch, create a Variable: Create called Box_Count and put a Variable: Modify on the same path, with Assign Mode set to Set (=) and referencing countAB from Tracker Line Count. The Else branch can go straight back to the While Loop's End.
Part 3 · Sort the box types with a Switch Case
Put a Switch Case after Box_Count is written, with Switch Value referencing the label of the object that was just counted.
| Parameter | Value | Description |
|---|---|---|
| Input Type | String | Box types are text, so the comparison is a text one |
| Switch Value | label from Tracker Line Count · countedObjects/0/label | The type of the box that just crossed |
| Case 1 Value | white_box | White box |
| Case 2 Value | brown_box | Brown box |
| Case 3 Value | black_box | Black box |
| Case 4 Value | blue_box | Blue box |
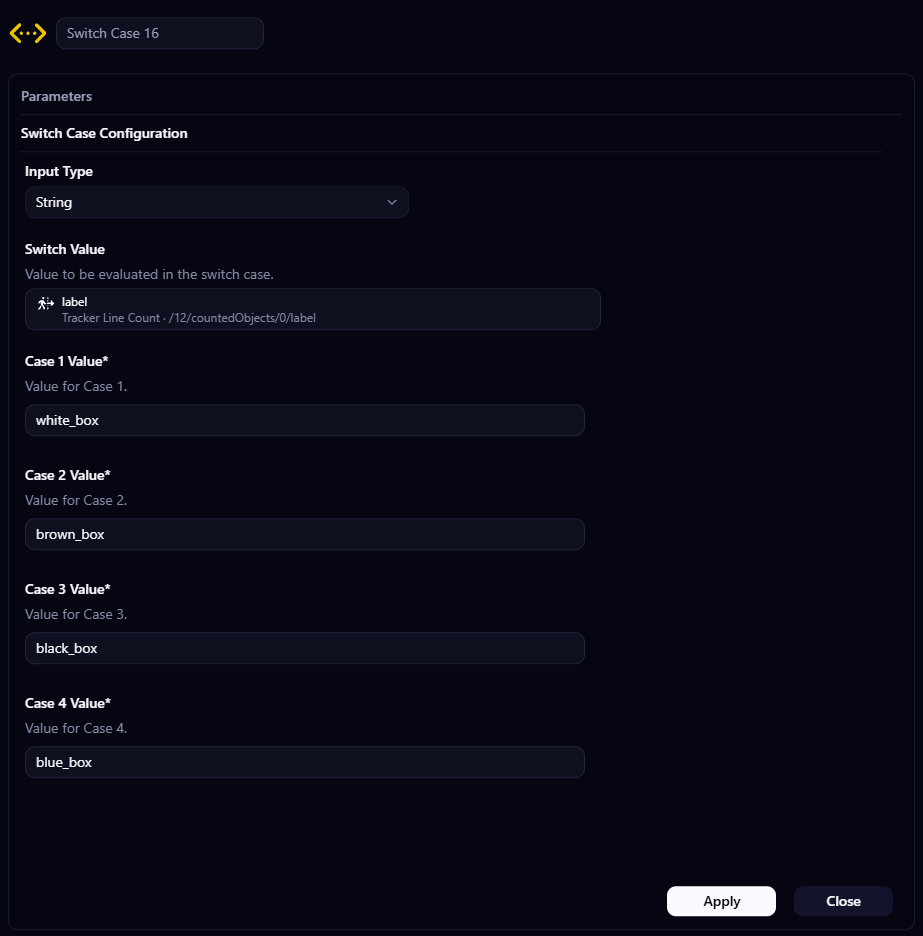
Case values have to match the model's labels character for character
A String Switch Case matches exactly. If the model sends white_box but the Case says White_Box, the values do not match and the Flow takes the Default path every time.
Each Switch Case output connects to its own Variable: Create, holding the Handling Type for that box type as a string.
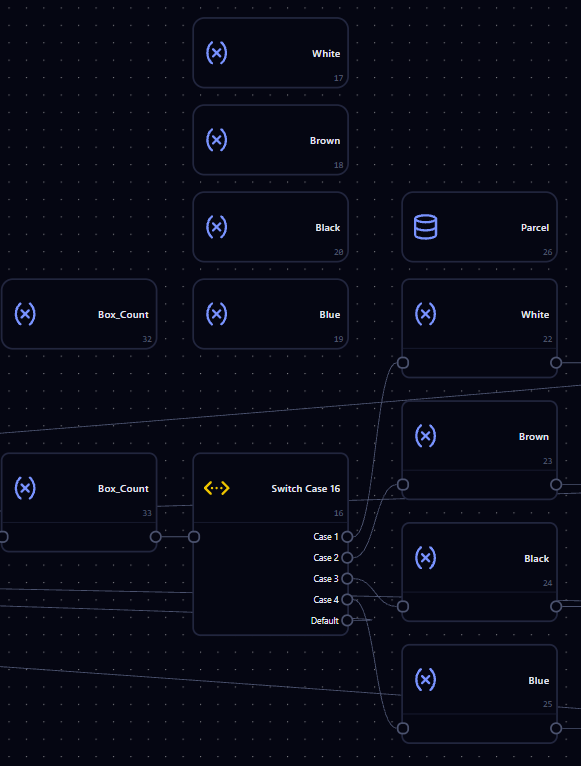
| From output | Node name | Example Handling_Type |
|---|---|---|
Case 1 · white_box | White | Standard |
Case 2 · brown_box | Brown | Critical |
Case 3 · black_box | Black | Critical |
Case 4 · blue_box | Blue | Urgent |
The values in the right-hand column are only examples. Set them to whatever matches how parcels are actually handled on site.
Part 4 · Create the Parcel table
Drop in a DB Table: Create or Use and name the table Parcel, with Table Create Mode set to Append and Primary Key Type left at its default of Integer Auto-Increment, so there is no need to create a primary_id Column yourself.
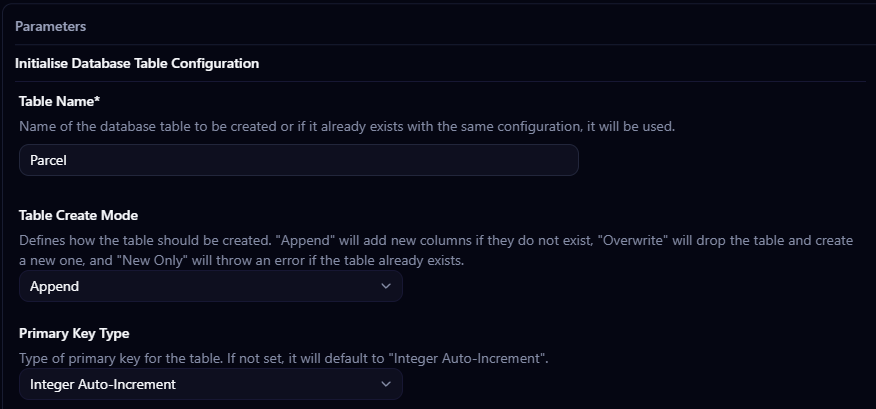
Scroll down to Column Definitions and press + to add the four Columns one at a time. Is Nullable and Is Unique can all be left off.
| Column Name | Column Data Type |
|---|---|
Box_Type | String |
Handling_Type | String |
Speed | Number |
TimeStamp | Number |
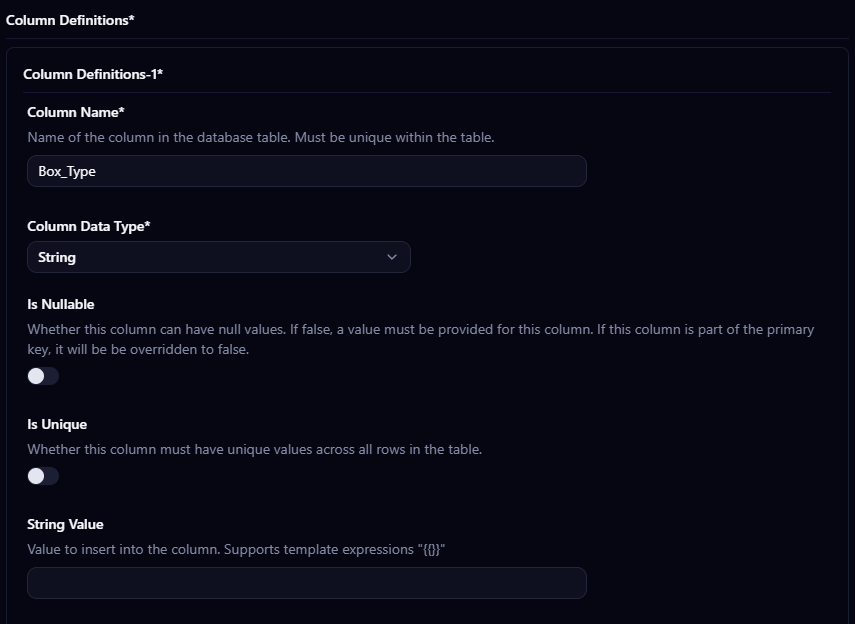
The other three Columns are set up the same way, changing only the name and the Data Type.
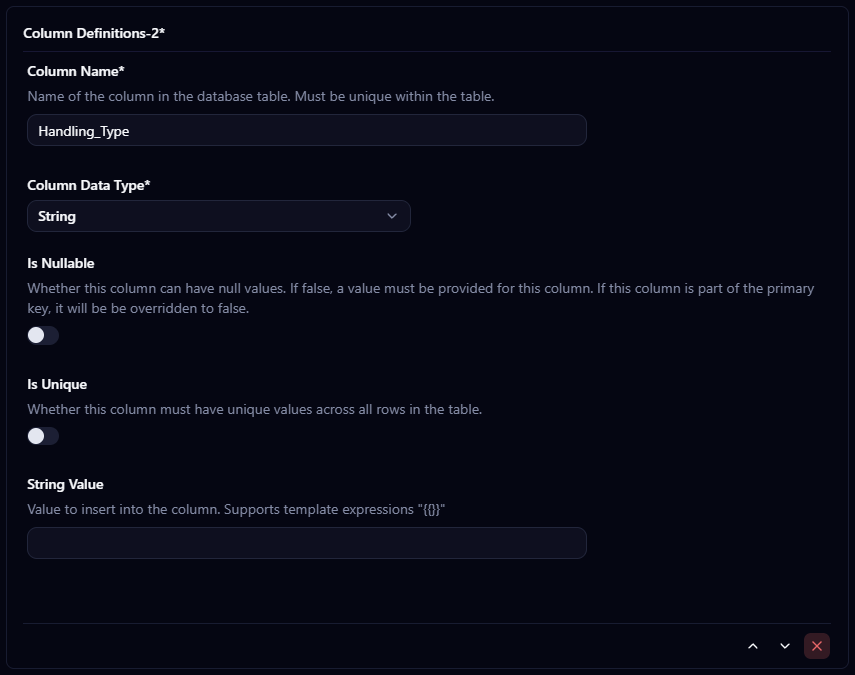
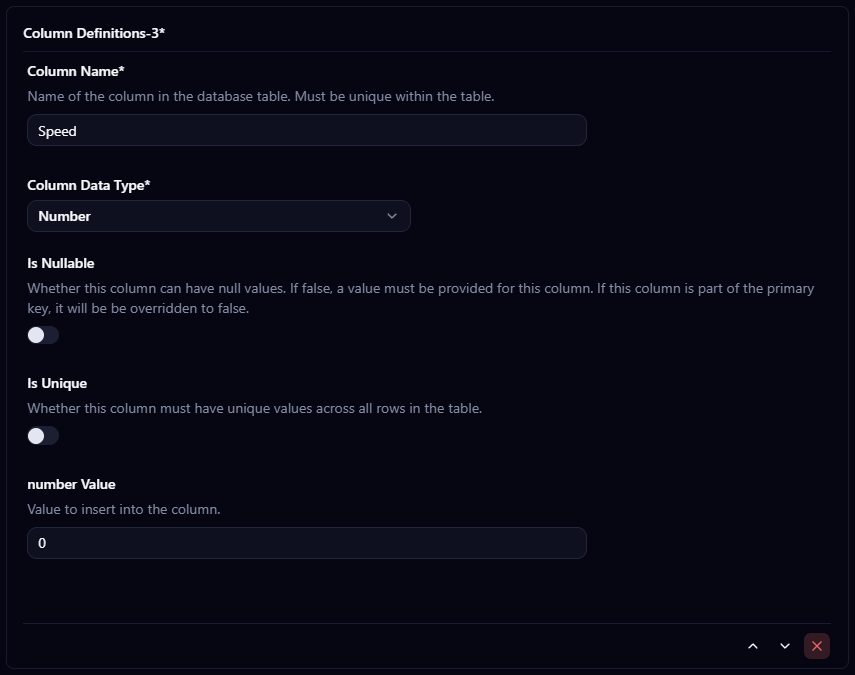
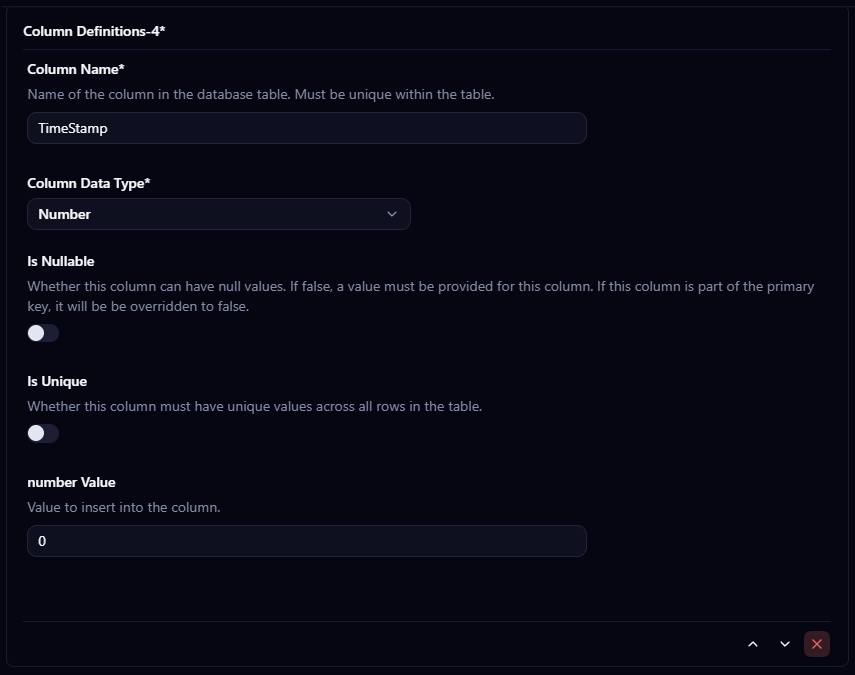
What each field on this configuration page does is covered in Database Table · Storing Data in a Table. If it doesn't feel familiar yet, go back and read that first.
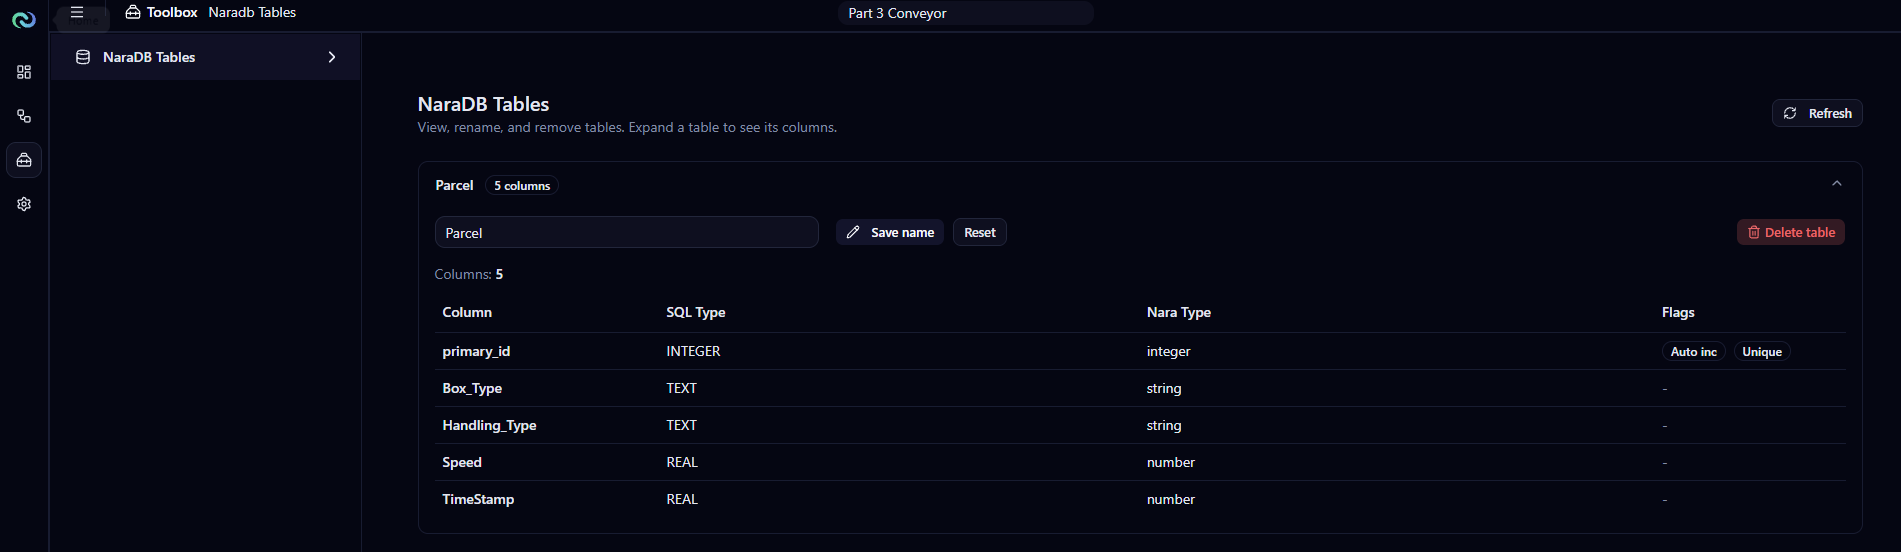
Once deployed, the table shows up under the Toolbox → NaraDB Tables tab, with the system-generated primary_id added as the first column, five columns in all.
Part 5 · Write the data to the table
Each Switch Case path gets its own DB Table: Row Insert. All four Nodes point their Variable Source back at the same DB Table: Create or Use, so they all write to the same Parcel table. The only difference is the Handling Type coming from their own path.
| Column | Reference |
|---|---|
Box_Type | label from Tracker Line Count · countedObjects/0/label |
Handling_Type | The variable from that path (White / Brown / Black / Blue) |
Speed | speed from Tracker Line Count · countedObjects/0/speed |
TimeStamp | The time of the crossing, from Tracker Line Count |
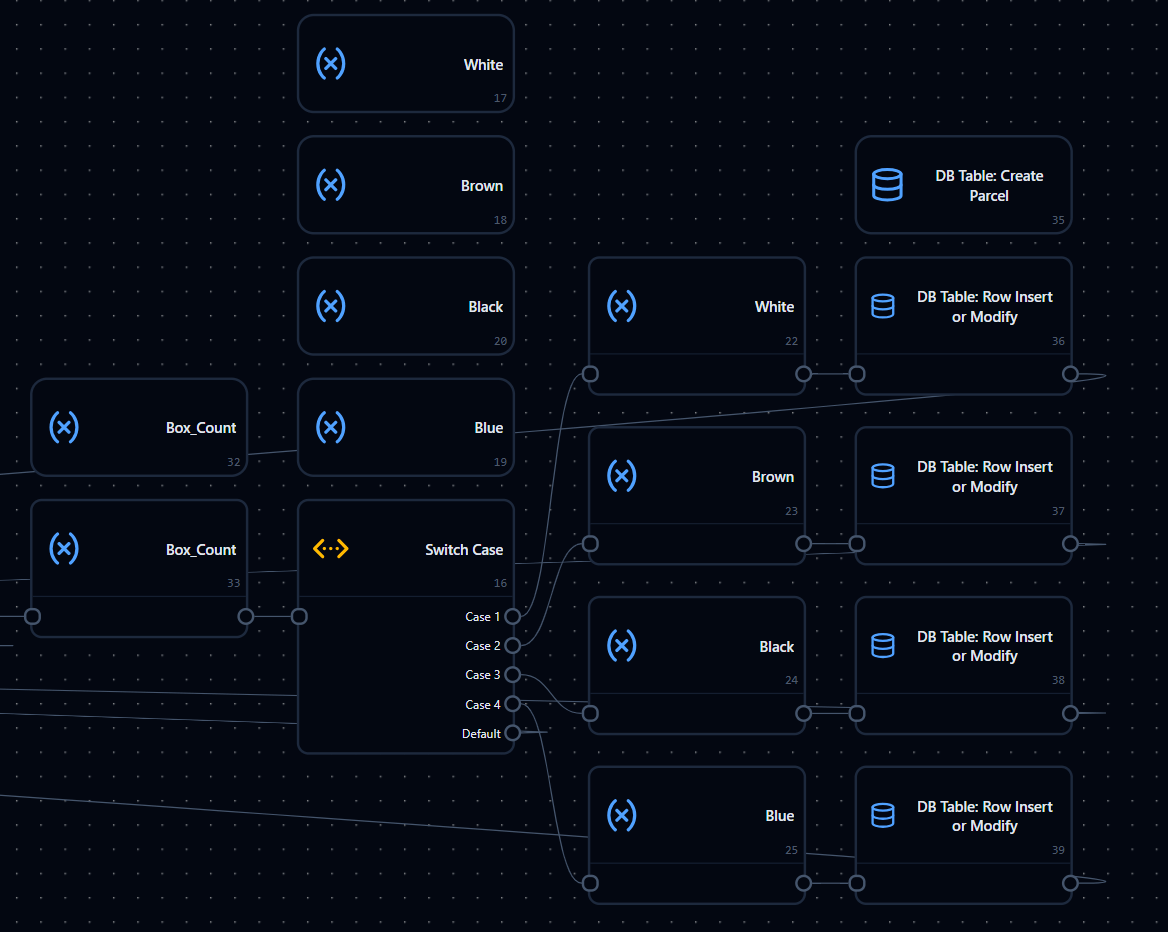
Part 6 · Finish wiring the Flow
Connect everything up, and don't forget that every path has to lead back to the While Loop's End, including the If-Then Else branch that never touches the database.
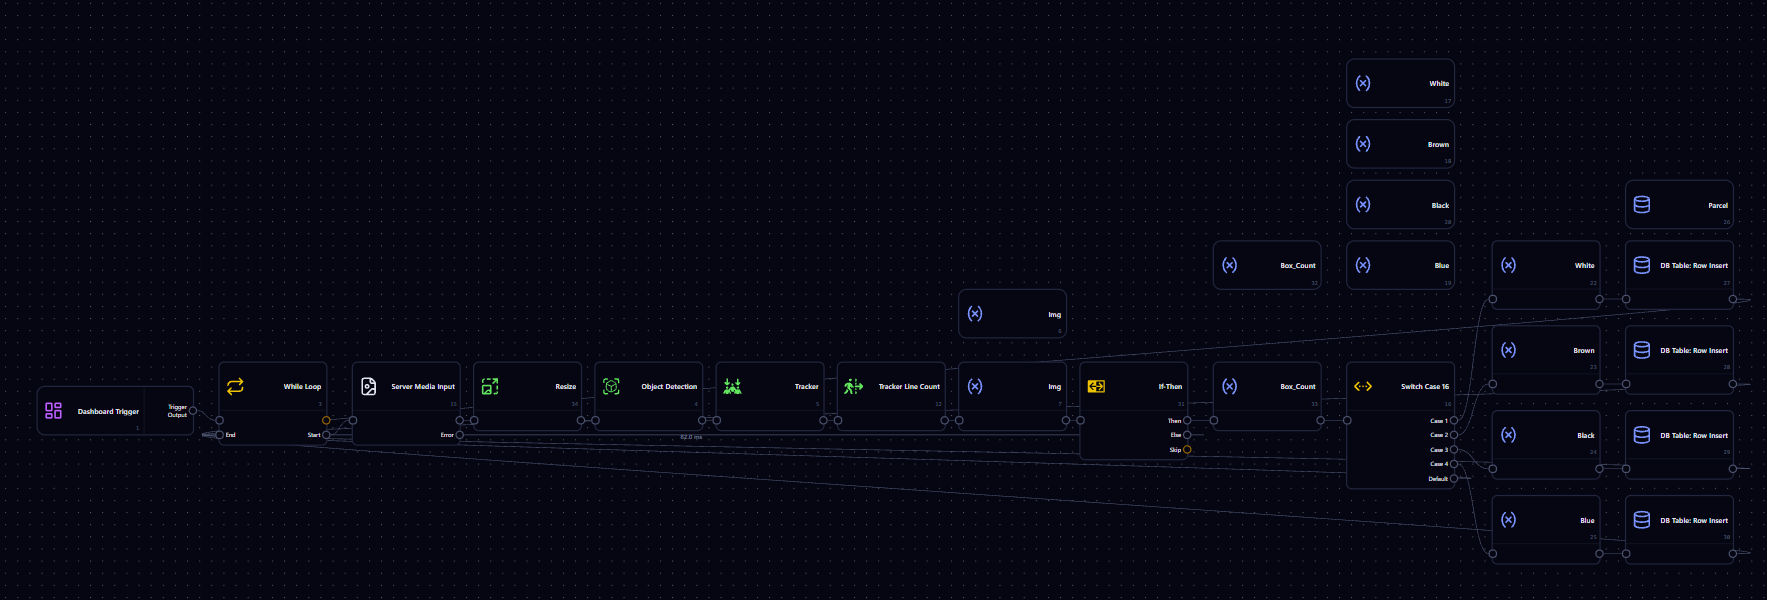
Part 7 · Lay out the Dashboard
The last step is arranging the Dashboard so the video, the counted values, and the parcel list all sit on one page.
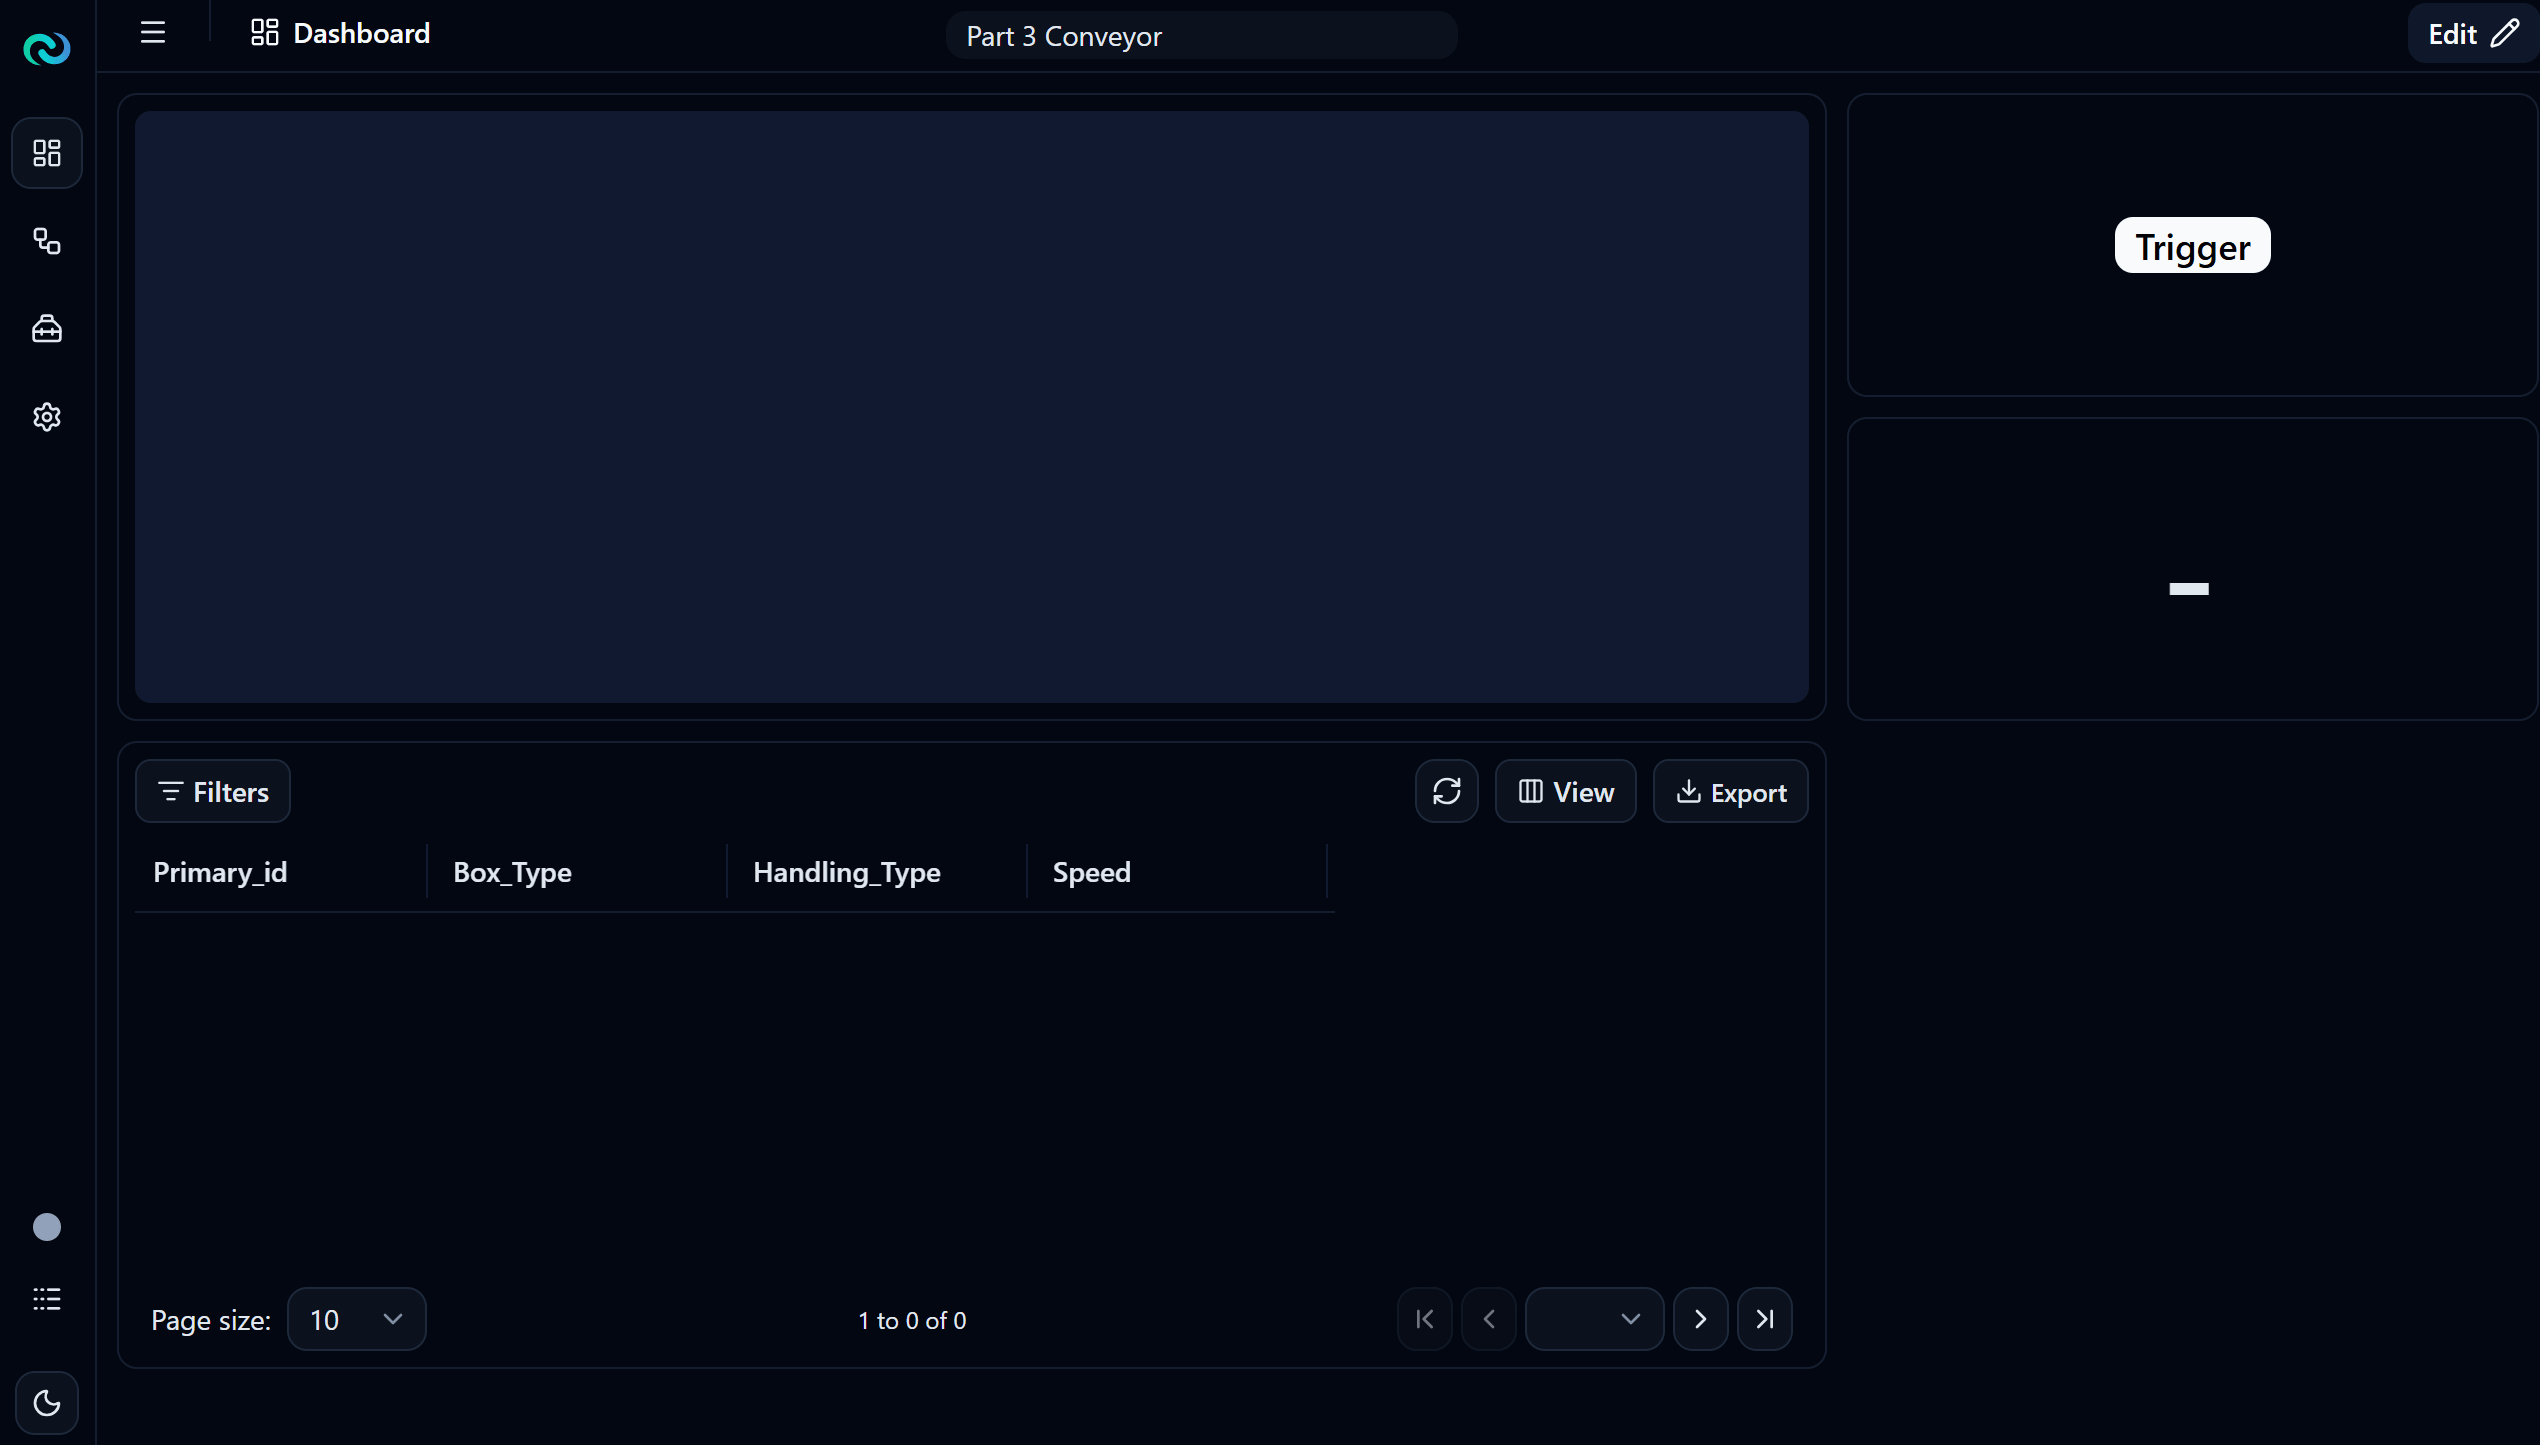
Drop in five Widgets and point each one at the right source. Adding a Widget and picking its Data Source is covered in the basic course, so here it is just a list of what to set where.
| Widget | What to set |
|---|---|
| Image Frame | Data Source → Img |
| Trigger Button | Trigger Id → trigger, the same string as the Dashboard Trigger ID on the Node in the Flow |
| Basic Display #1 | Data Source → Box_Count |
| Basic Display #2 | Data Source → whichever variable you want to keep an eye on |
| Array Object Table | Data Source → Parcel, then add Column Item Infos for all five columns in the table: primary_id, Box_Type, Handling_Type, Speed, and TimeStamp |
The Trigger Id has to match exactly
The Trigger Button does nothing at all if its Trigger Id and the Node's Dashboard Trigger ID differ by so much as one capital letter. If pressing the button gets no reaction, compare those two strings before looking anywhere else.
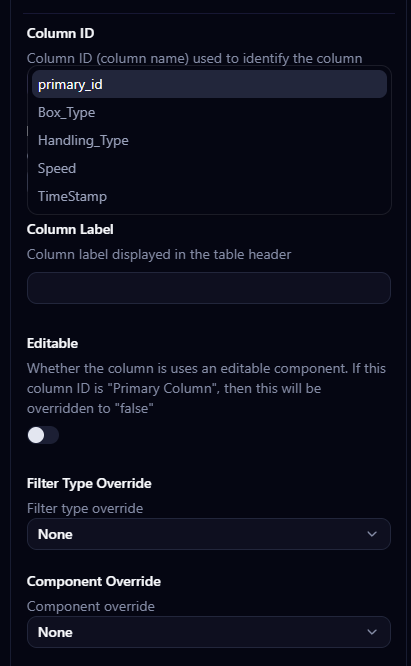
9. Flow Explanation
After deploying, pressing the Trigger Button drops the system into the While Loop, where one pass processes one frame.
Server Media Input hands the frame to Resize, which normalises the size, and passes it on to Object Detection, which returns bounding boxes for the parcels found in that frame. The Tracker then takes those boxes and matches them against the ones from the previous frame, so the system knows which box is the same one still moving.
Tracker Line Count takes that tracked data and compares it against the line you drew. If no box crossed on that pass, countAB is 0; if one did, the Node sends the details of the event out in countedObjects.
If-Then acts as the filter, letting only the passes with a real crossing carry on to the next step. Passes where nothing happened go straight back to the While Loop's End without touching the database. That is why the Parcel table gains a row only when a box crosses, rather than on every frame a box is detected in.
Past the filter, the system writes the Box_Count for that moment. The Switch Case then works out which type the box that just crossed is and sends it down the matching path, where the Handling Type is set before DB Table: Row Insert writes a single row to the Parcel table.
Meanwhile the Variable Modify for the picture runs on every pass, regardless of whether anything crossed, because the video on the Dashboard has to keep playing continuously.
10. Testing Scenarios
The normal case: before anything crosses, Box_Count is 0 and the Parcel table is empty. When the first box crosses, Box_Count shows a value and the table gains its first row. Once the box has passed, Box_Count goes back to 0 but the row stays. The next box produces another row the same way, always one box to one row.
Other things worth testing
- Count the boxes in the video by eye and compare that against the number of rows in the
Parceltable. The two numbers should agree. - Move the counting line somewhere else on the picture and check whether the total comes out the same.
- Let the video run with a single box visible for several seconds, and check that the table gains one row, not several.
- Try a box type that isn't in any Case, and watch the Flow take the Default path with no new row appearing.
- Compare the
Speedrecorded for a fast-moving box against a slow one, and see whether the values match what you see in the video.
11. Troubleshooting
- The table gains a row on every frame: the If-Then condition isn't filtering on
countAB, or DB Table: Row Insert is wired outside the path that passed the condition. - Boxes go past but
Box_Countstays at 0: check that the counting line is somewhere boxes actually pass, that the counting direction matches the direction of travel, and that the Tracker is wired in before Tracker Line Count. Box_Countfires far too often even when no box has crossed: the Tracker isn't keeping objects continuous, so the system reads the same box as a new object in every frame.- Every box takes the Default path: the Case values don't match the labels the model sends. Check the upper and lower case and the underscores match character for character.
- The counting line lands in the wrong place after moving the Flow to a different camera: the new camera's picture is at a different resolution. Check that Resize is set to the same Size as when the line was placed, and that Object Detection is referencing the picture from Resize rather than from Server Media Input.
- Detection boxes show on the Dashboard but the counting line doesn't: the image Variable Modify is still referencing the output from Object Detection. Switch it to
frameOutfrom Tracker Line Count. - The table on the Dashboard is empty even though the Flow is running: the Array Object Table Widget hasn't had
Parcelselected as its Data Source, or the Column Item Infos haven't been added. - The video plays once and stops: a path inside the loop hasn't been wired back to the While Loop's End, so the pass never completes.
- An error as early as creating the table: the table name or a Column name contains a space or a special character. Use
_instead of spaces.
12. Challenges and Summary
Challenge 1: Build your own running total. Add a counter variable for each box type and have each Switch Case path add to its own total whenever a box crosses, so you can see how many of each type went past during a shift. Unlike Box_Count, this value never goes back to 0.
Challenge 2: Add alerting on top, taking the change-of-state idea from Mini Project 2 · Machine Status Monitoring to raise an alert whenever a box that needs urgent handling turns up.
Project Summary: This project covers the whole path from picture to database: Object Detection saying which objects are in the frame, the Tracker giving those objects continuity across frames, Tracker Line Count turning that continuity into a crossing event, If-Then filtering down to the real events, the Switch Case sorting them by type, and the Database Table storing the results for later.
The key concept is the difference between what is currently in the Frame and what has just happened. Counting parts on a conveyor, vehicles entering or leaving an area, and people passing through a doorway all use this structure.
Course complete
Getting this far means all 3 Mini Projects of the intermediate course are done. The next step is taking what you've learned here and applying it to your own real work.
Mini Project 2 · Machine Status Monitoring
Practice building an Event-driven Flow that reads machine temperature on a schedule, smooths it before deciding anything, sorts it into Normal, Warning and Critical, counts the critical passes until it hits the limit and stops the machine, with a Reset button that only works once the temperature is back to normal.
Dashboard Trigger
Next Page