
Mini Project 2 · Machine Status Monitoring
Practice building an Event-driven Flow that reads machine temperature on a schedule, smooths it before deciding anything, sorts it into Normal, Warning and Critical, counts the critical passes until it hits the limit and stops the machine, with a Reset button that only works once the temperature is back to normal.
1. Overview
Mini Project 1 taught a Flow to react to what is in the picture. This one swaps the picture for a number that keeps changing: the temperature of a machine, what state that puts it in, and whether the machine should keep running or be shut down.
What you'll build is a Flow that runs on a timer, reads a temperature, averages it over the last few readings so it stops jumping around, and sorts the result into three levels: Normal, Warning, and Critical. From there it counts how many passes the machine has spent in the critical range, and the moment that count reaches three, the Flow shuts the machine down.
Once the machine has been stopped, it does not start itself again even if the temperature drops. Someone has to fix the problem and press Reset on the Dashboard, and even that button refuses to do anything while the temperature is still high. That part takes the most thought, because a temperature coming down and a problem being fixed are not the same event. The Flow has to keep the two in separate places.
2. Learning Objectives
By the end of this project, the learner will be able to:
- Use a Time Interval Trigger to build a Flow that checks itself on a schedule
- Explain why a sensor reading should be smoothed before it is compared against a threshold
- Nest If-Then Nodes to split a number into bands, in the right order
- Keep the variable holding "the measured state" separate from the one holding "the decision the system made"
- Count events with Assign Mode Add (+) and put a ceiling on the counter so it doesn't climb forever
- Build a Reset path that has to pass a check before it does anything
- Lay out a Dashboard where test values go in, commands go out, and results come back on the same page
3. Prerequisites
- Completed the basic course and able to build a Flow from scratch (see Build Your First Flow)
- Completed the Operation topics, especially If-Then and Moving Number Calculation, which this project uses to average the temperature
- Comfortable with Variable: Create and Variable: Modify
- No real sensor needed. This project uses a Number Slider on the Dashboard to stand in for one
4. Expected Result
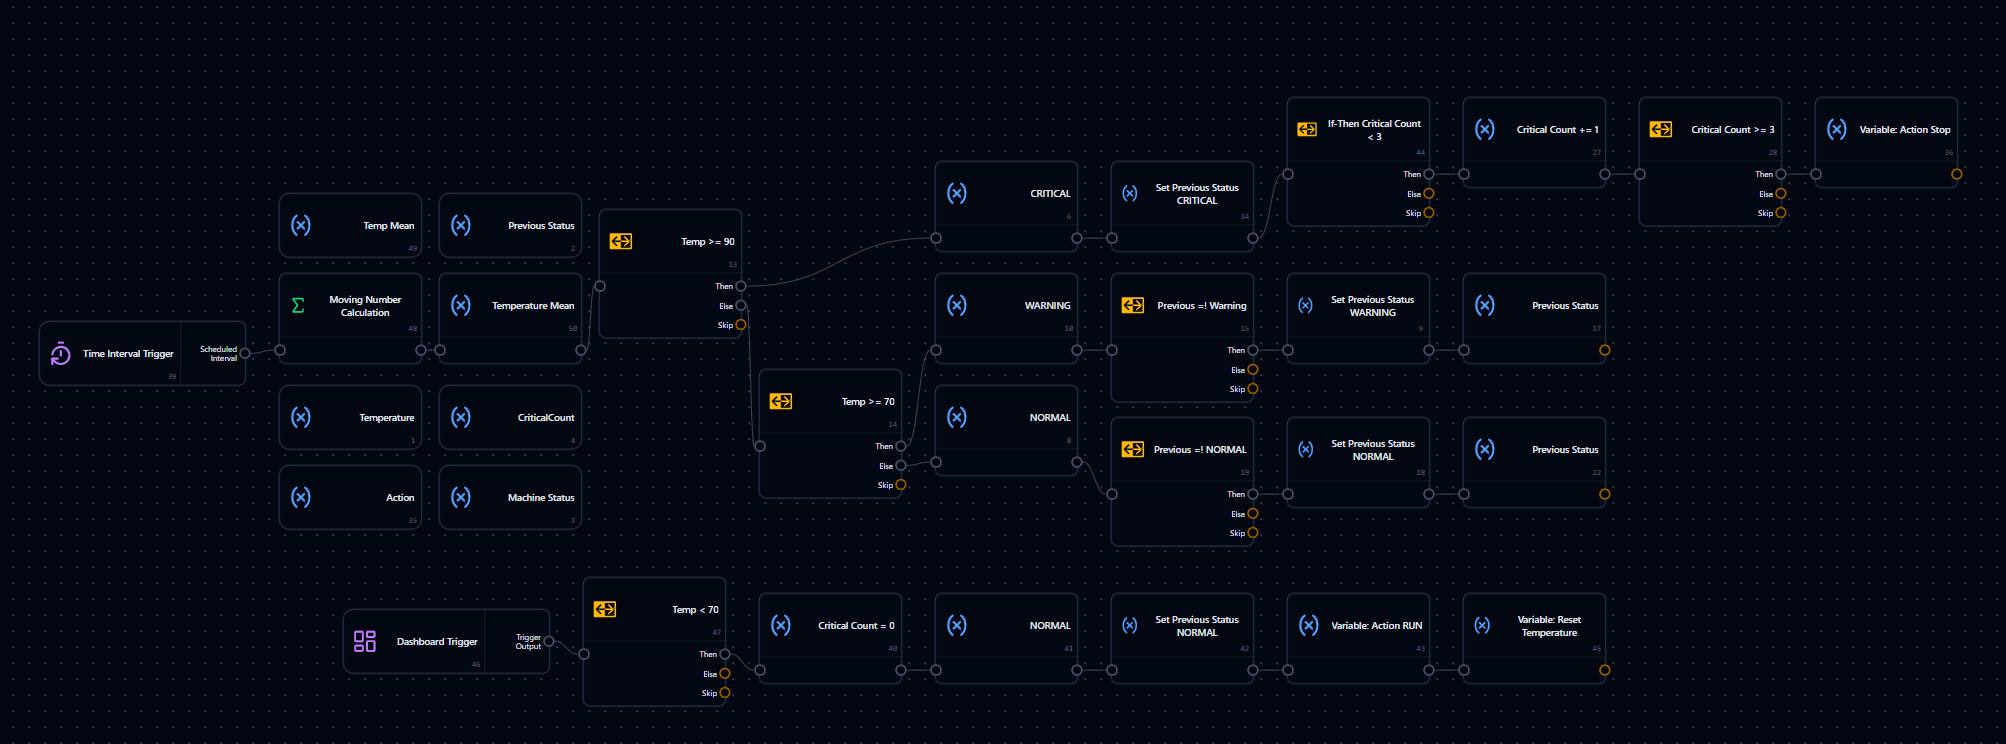
Once everything is wired up, the Flow looks like this. It's a lot to take in at once, but every Node gets added one section at a time in the Guided Workshop, and each section is something you can deploy and try before moving on.
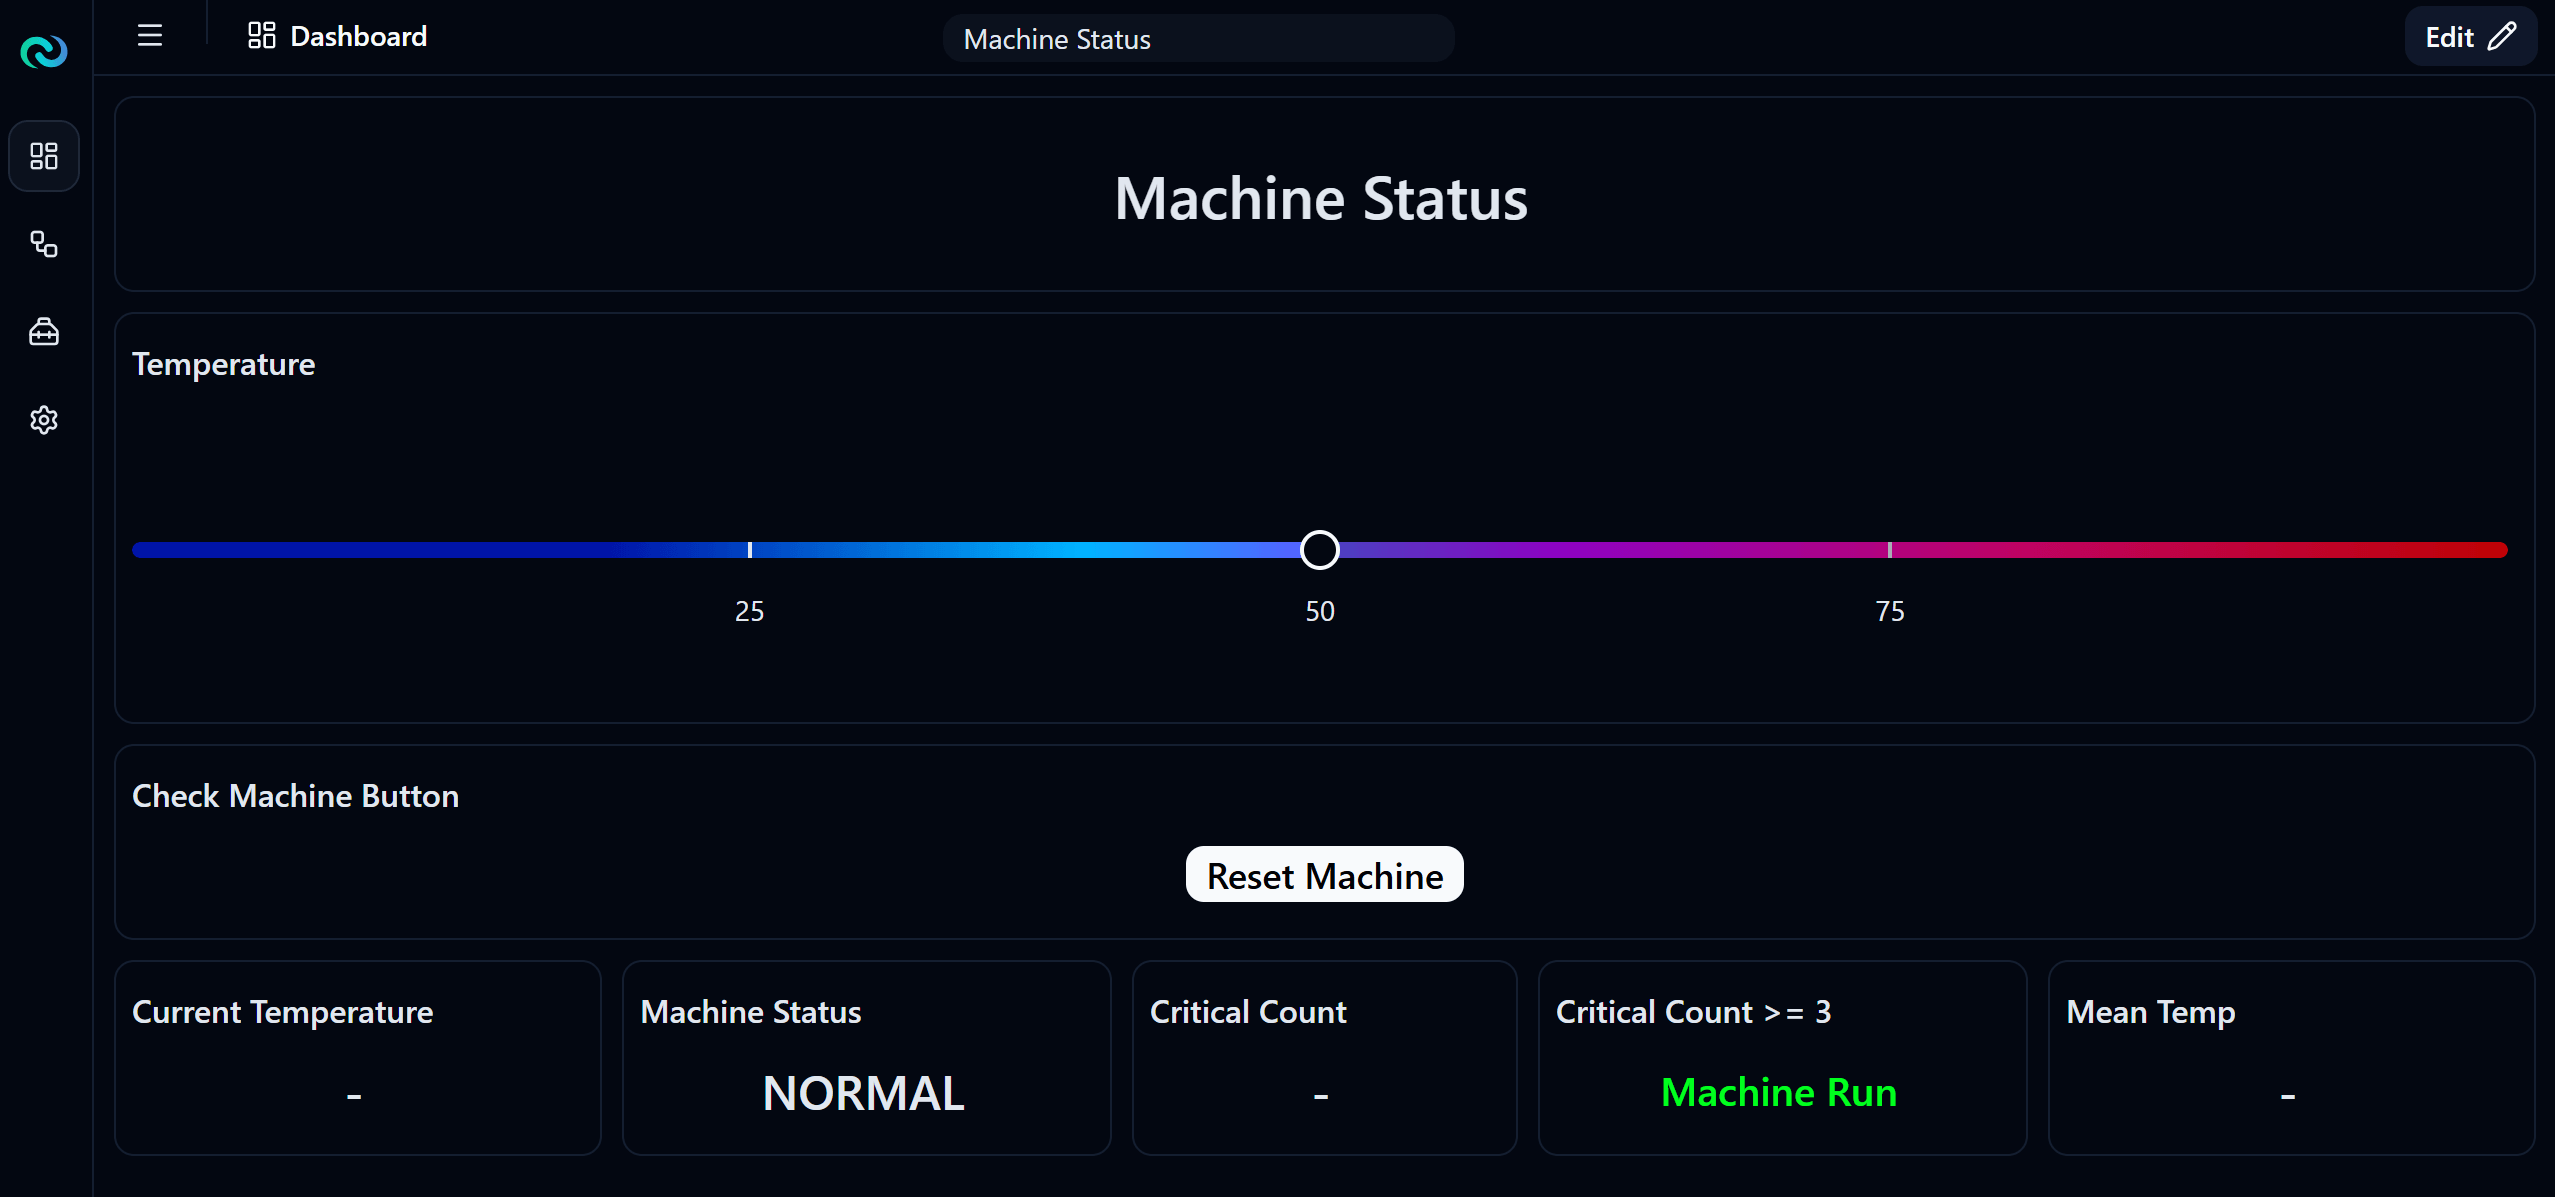
On the Dashboard side there's a slider for the temperature, a Reset Machine button, and five readouts. Move the slider and the values follow within the next pass.
The thresholds used here split the range three ways:
| Average temperature | Machine Status | What happens to Critical Count |
|---|---|---|
| 90 and above | CRITICAL | Goes up by 1 per pass, up to 3, then stops |
| 70 up to 89 | WARNING | Left alone |
| Below 70 | NORMAL | Left alone. This is the only band where pressing Reset does anything |
The moment Critical Count reaches 3, the Action variable is set to Machine Stop and stays there until someone presses Reset.
The Reset button only works once the status is back to NORMAL. Put plainly: somebody has to fix the problem and bring the temperature down before the machine will run again. Press it while the status is still CRITICAL or WARNING and nothing happens.
This counter counts passes, not events
Leave the temperature at 95 and Critical Count climbs 1 → 2 → 3 with each pass the Flow makes, then stops at exactly 3, because an If-Then checking Critical Count < 3 sits in front of the increment. Read that way, the count means "hot for three passes running and nobody has fixed it yet", which is a different question from how many separate times the machine went critical. If you want the second reading instead, that's one of the challenges at the end.
5. System Architecture
Everything happens inside NARA. The temperature is the input, the averaging and the threshold checks are the processing, and the Dashboard is the output.
Unlike Mini Project 1, there is no While Loop here. The repetition comes from the Trigger itself, and one Trigger pass is one check. There is also a second Trigger, the button on the Dashboard, which only runs when someone presses it.
6. Flow Architecture & Nodes
The Flow uses the Nodes below. Anything that is basic configuration or left at its default is not spelled out again.
| Order | Node | Role |
|---|---|---|
| 1 | Time Interval Trigger | Starts a check every time the interval elapses |
| 2 | Dashboard Trigger | Picks up the Reset Machine button press from the Dashboard |
| 3–8 | Variable: Create × 6 | Creates Temperature, Temp Mean, Machine Status, Previous Status, CriticalCount and Action |
| 9 | Moving Number Calculation | Averages recent readings so the value settles before it is compared |
| 10 | Variable: Modify Temperature Mean | Stores the average in Temp Mean so the Dashboard can show it |
| 11 | If-Then Temp >= 90 | Splits Critical off from everything else |
| 12 | If-Then Temp >= 70 | Splits Warning off from Normal |
| 13–15 | Variable: Modify CRITICAL / WARNING / NORMAL | Write the current status into Machine Status |
| 16–17 | If-Then Previous =! Warning / Previous =! NORMAL | Check whether this pass is the moment the state changed |
| 18–20 | Variable: Modify Set Previous Status ... × 3 | Remember the latest status for the next pass |
| 21 | If-Then Critical Count < 3 | The ceiling, so the counter can't go past the limit |
| 22 | Variable: Modify Critical Count += 1 | Adds one for this pass |
| 23 | If-Then Critical Count >= 3 | Has the limit been reached? |
| 24 | Variable: Modify Action Stop | Writes Machine Stop into Action |
| 25 | If-Then Temp < 70 | The gate on the Reset button, confirming the temperature really is back down |
| 26 | Variable: Modify Critical Count = 0 | Clears the counter |
| 27–28 | Variable: Modify NORMAL / Set Previous Status NORMAL | Put the status and the previous status back to NORMAL |
| 29 | Variable: Modify Action RUN | Writes Machine Run into Action |
| 30 | Variable: Modify Reset Temperature | Clears the stale temperature so an old reading can't pull the status straight back to critical |
On the Dashboard side there are 8 Widgets:
- Basic Display × 6, for the page title, the current temperature, the machine status, the average, the counter, and the run command
- Number Slider × 1, for feeding in a simulated temperature
- Trigger Button × 1, for the Reset Machine button
7. Key Concepts
Core concept of this project
The reading tells you how hot the machine is. The thresholds tell you what to call that. The counter tells you whether it has been that way long enough to act on. Those three live in three separate variables, because each one changes for a different reason.
Why average the reading first
Sensor readings are never still. The real temperature might be sitting around 89 while the readings come back 88, 91, 89, 90, 88. Compare those raw numbers against a threshold of 90 and the Dashboard flickers between Warning and Critical while nothing about the machine has changed at all. Worse, in this project, the counter would jump and shut the machine down when it shouldn't.
Moving Number Calculation averages the last few readings and hands the steadier number to If-Then. In exchange the status trails the real value by a pass or two.
Raw       88 → 91 → 89 → 90 → 88     status flips back and forth
Averaged  88 → 89 → 89 → 89 → 89     status holds
Why the thresholds go from high to low
The two If-Then Nodes have to nest, not sit side by side, because a value of 95 satisfies both >= 90 and >= 70. Check 70 first and 95 gets labelled Warning and never reaches Critical at all.
The rule is simple: always check the narrowest, most severe band first, and let everything else fall through the Else branch.
Machine Status and Action are not the same thing
Machine Status is what the system measured this pass. It changes with the temperature every time: hot means CRITICAL, cool means NORMAL.
Action is what the system decided. Once it has been set to Machine Stop it stays there, even after Machine Status has gone back to NORMAL, because a falling temperature does not mean the problem was fixed. It might just be cooling down because the machine already stopped turning.
Why the machine must not restart on its own
In a real plant, a machine stopped for overheating gets looked at before it runs again. Design it to restart the moment the temperature drops and the system just cycles: hot, stop, cool, run, hot again, with nobody ever finding out what caused it. Forcing a person to press the button is how you force a person to notice.
The ceiling on the counter
Critical Count += 1 doesn't hang directly off the CRITICAL branch. An If-Then checking Critical Count < 3 sits in front of it. Without that, the number would climb without end for as long as the machine stayed hot, and none of it would tell you anything you didn't already know at 3, because 4 and 40 both mean the same thing: the limit has been passed.
With the ceiling, the number stops at exactly 3, which keeps the Dashboard readable and means one thing only: the limit has been reached.
Two Triggers in one Flow
The Time Interval Trigger is the scheduled check; it runs on its own with nobody asking. The Dashboard Trigger only runs when someone presses the button. Both paths live in the same Flow without interfering, because each one has its own starting point.
8. Guided Workshop
Part 1 · Create all six variables
Start by placing the six Variable: Create Nodes, because everything else in the Flow refers back to them.
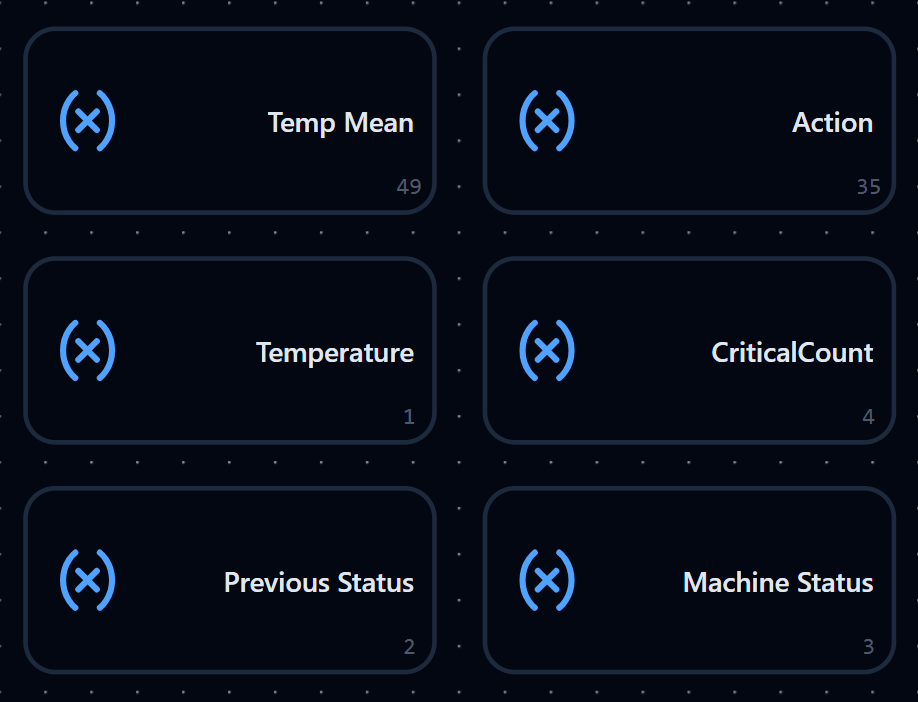
| Variable | Type | What it holds |
|---|---|---|
Temperature | number | The value coming from the Number Slider on the Dashboard |
Temp Mean | number | The average from Moving Number Calculation, kept for display |
Machine Status | string | The current status: CRITICAL, WARNING or NORMAL |
Previous Status | string | Last pass's status, used to spot a change |
CriticalCount | number | How many passes the machine has spent in the critical range |
Action | string | The run command: Machine Run or Machine Stop |
Part 2 · Prepare the Nodes that write to those variables
Next, place the whole set of Variable: Modify Nodes. They all do the same job, writing a value into a variable, and differ only in which variable and what value. Getting them all out first means you won't have to stop and create a new Node halfway through wiring.
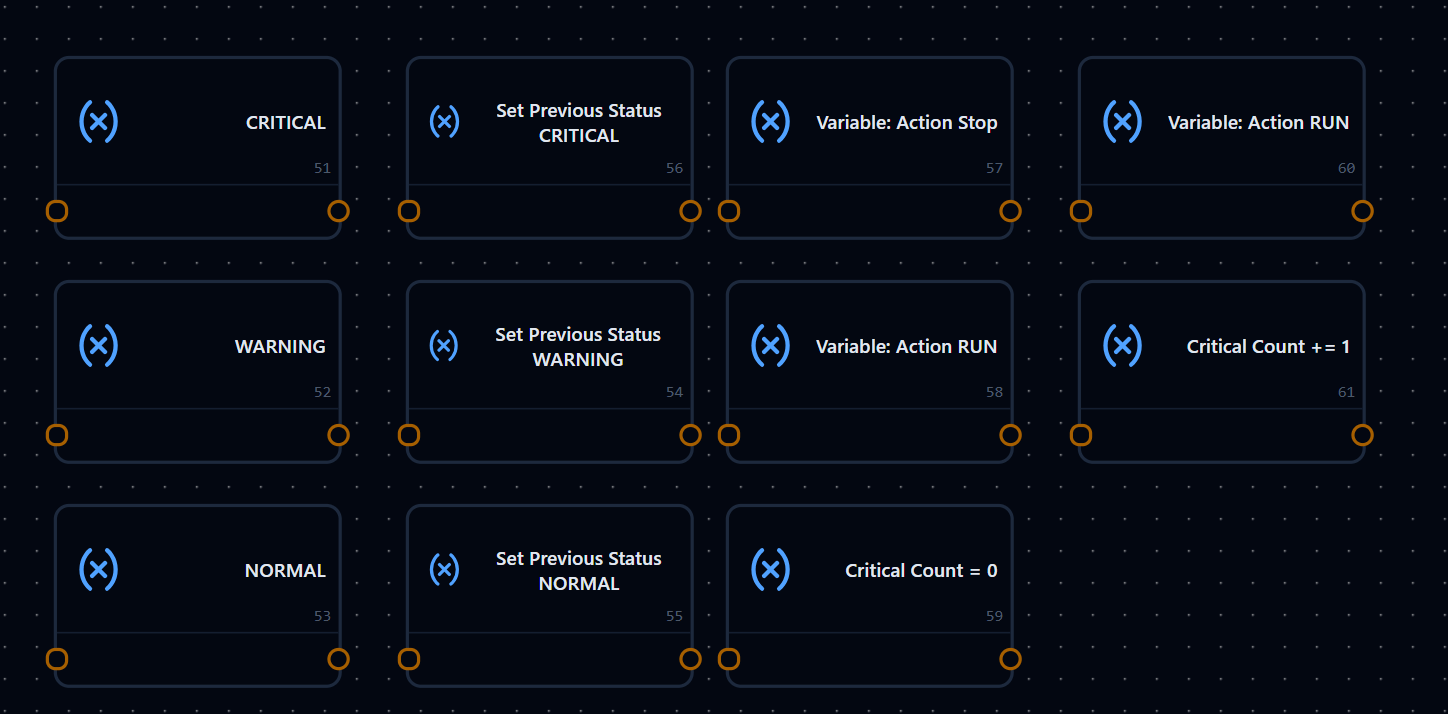
Name each Node for what it writes. There will be a dozen identical-looking Nodes on the canvas shortly, and if they all keep their default names you will never find the one you want.
Start with the three that write into Machine Status. Here is CRITICAL:
| Parameter | Value | Notes |
|---|---|---|
| Variable Source | Machine Status | The variable being written to |
| Assign Mode | Overwrite (=) | Replace whatever was there |
| Variable Value | CRITICAL | Typed in directly, no reference to another Node |
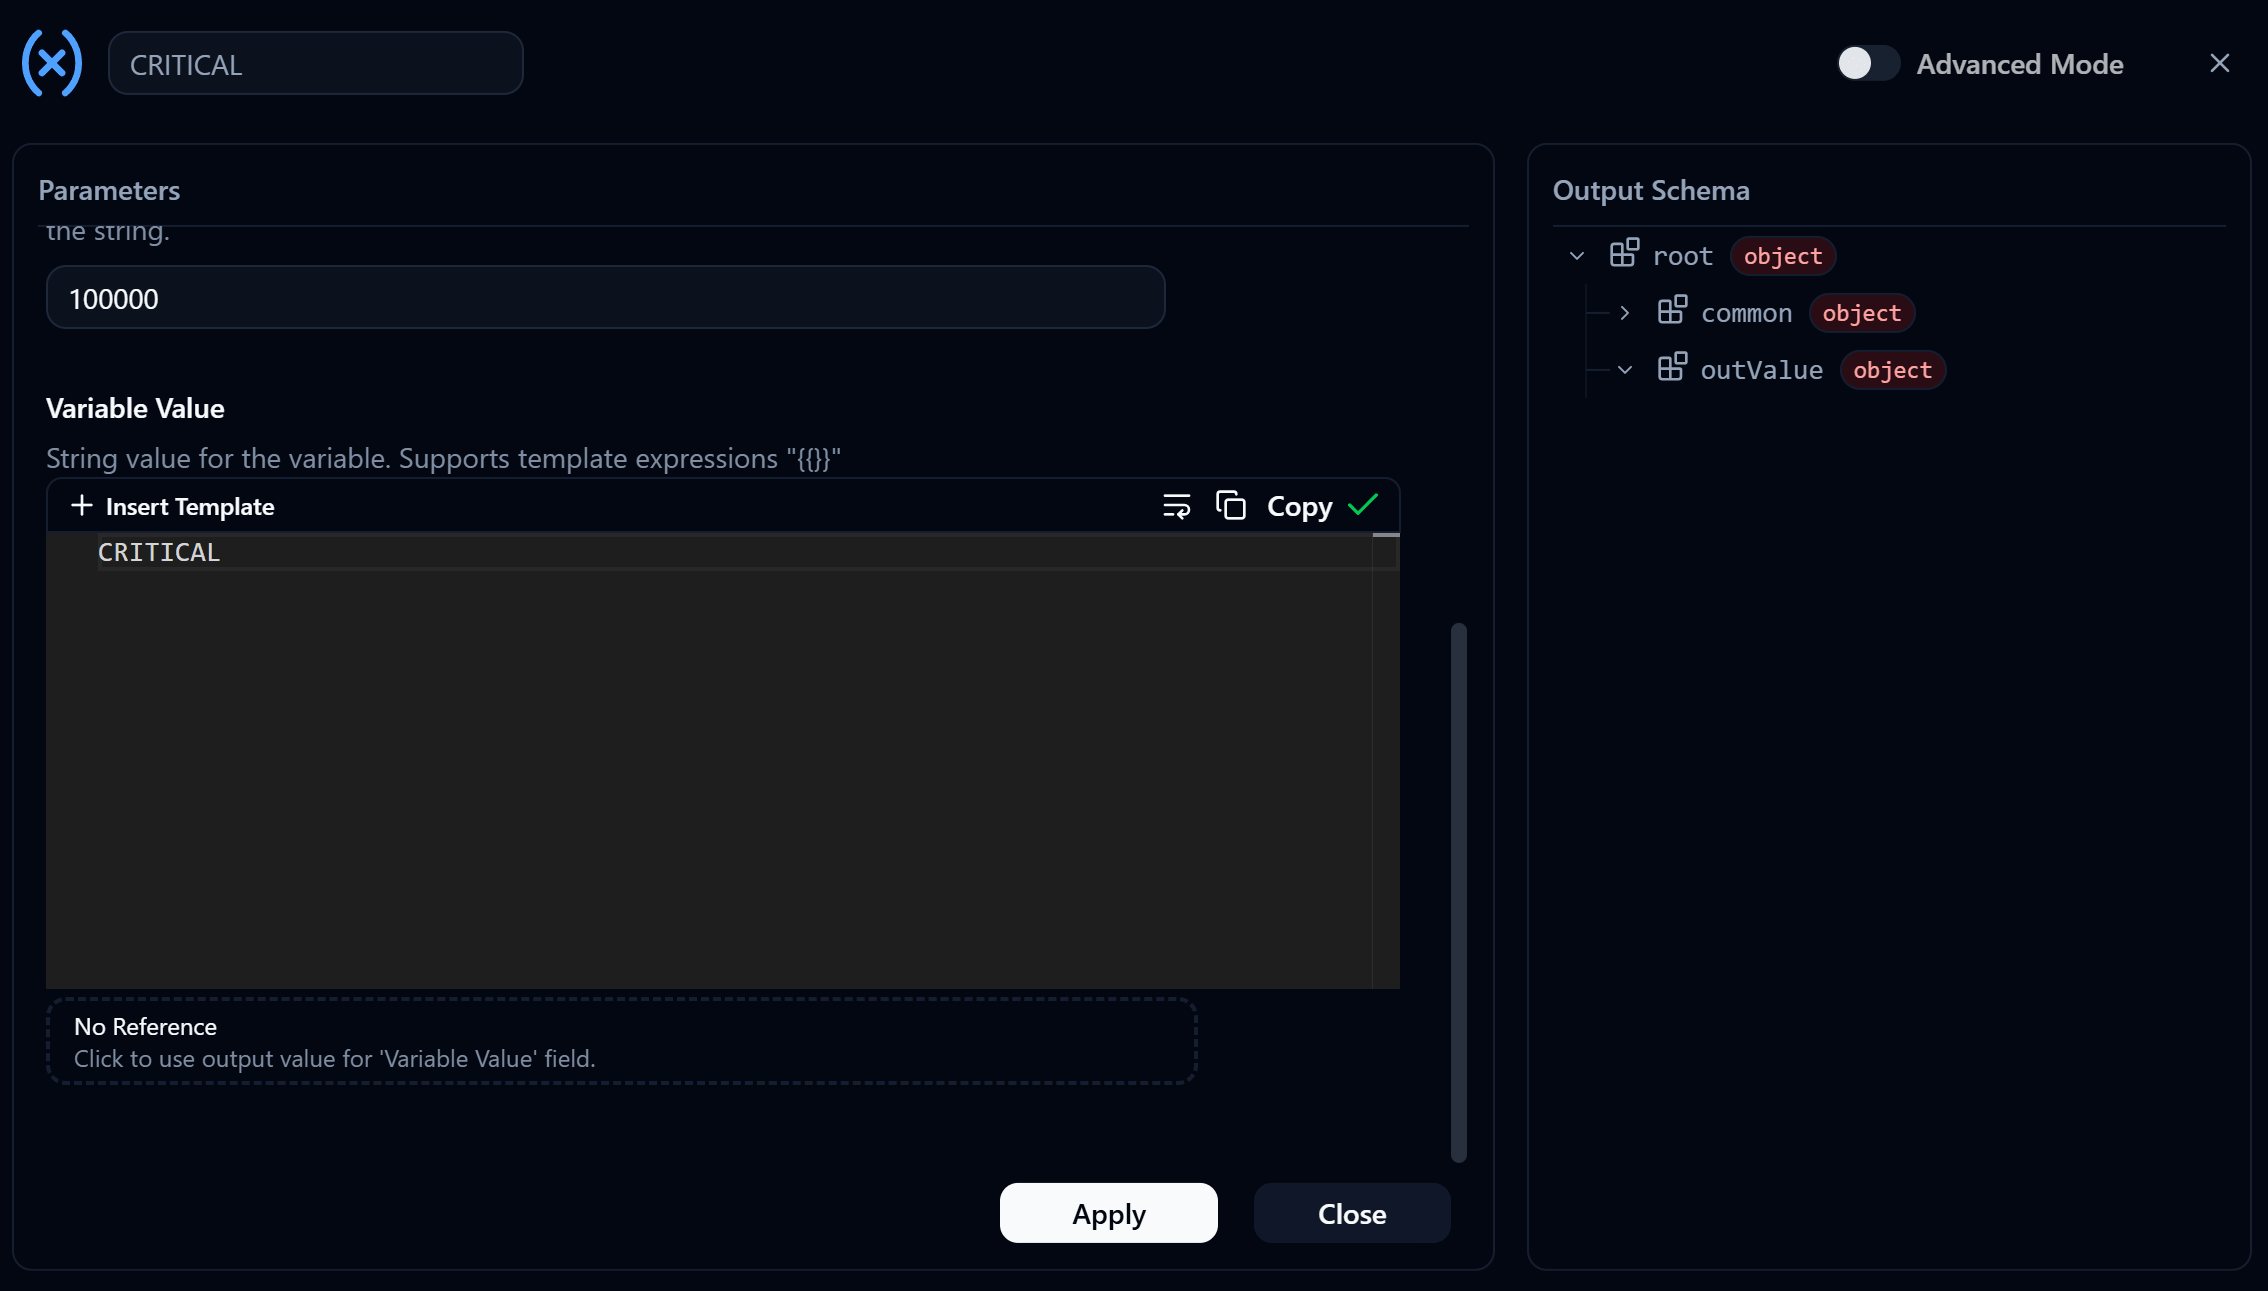
The other two are identical apart from the Variable Value, which becomes WARNING and NORMAL.
Then do the three that write into Previous Status. Same configuration again, except Variable Source points at Previous Status.
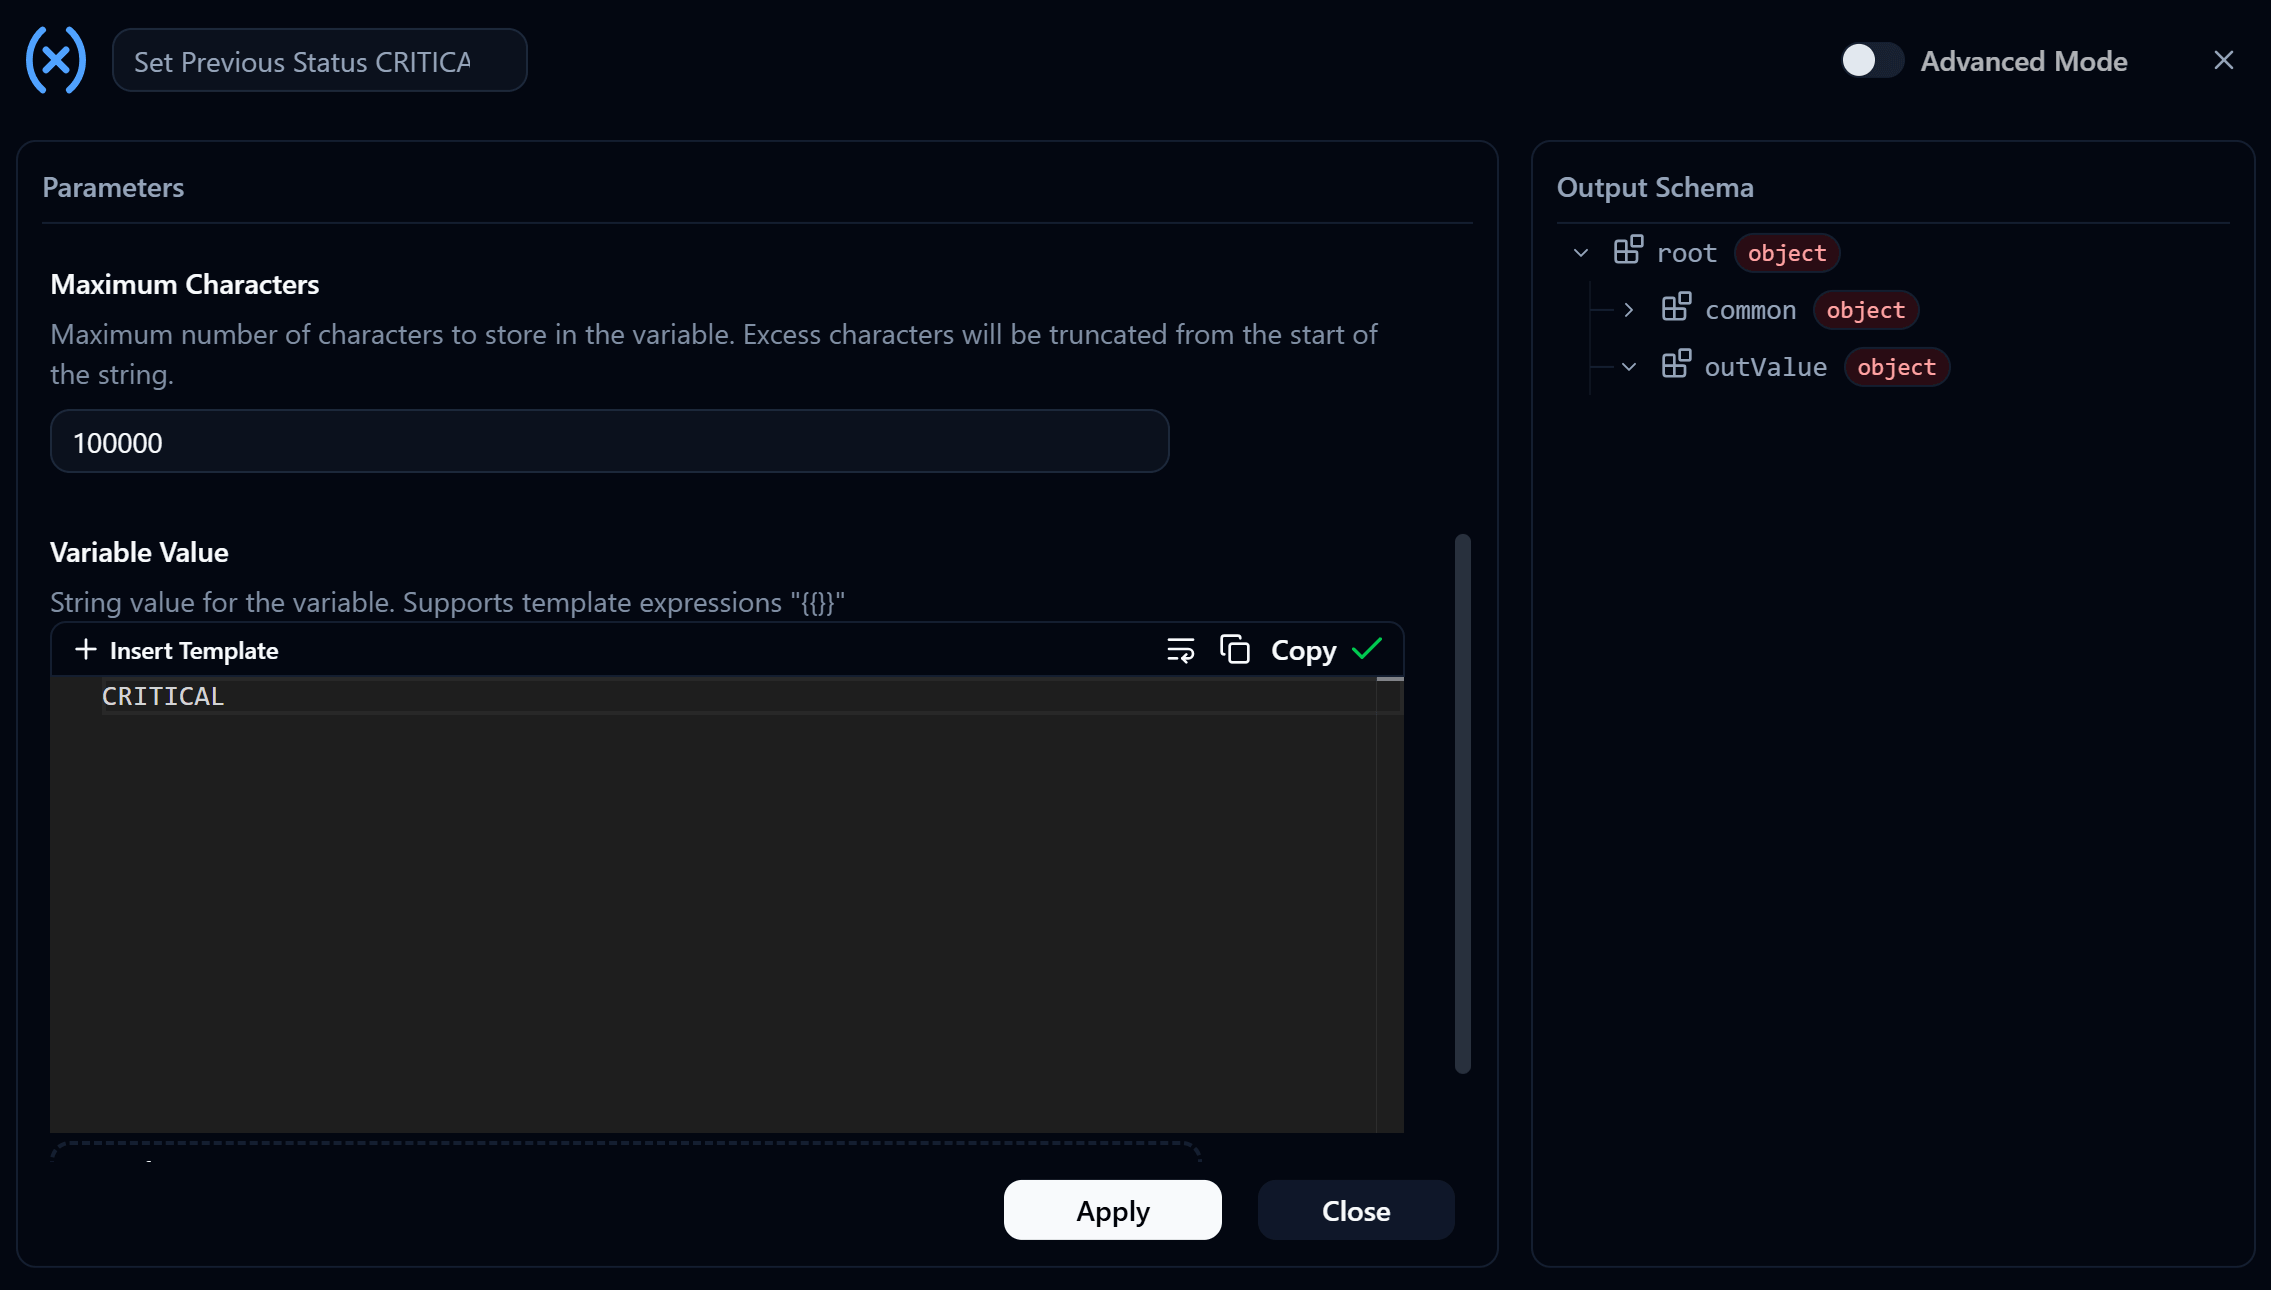
The remaining Nodes from that screenshot are configured like this:
| Node | Variable Source | Assign Mode | Variable Value |
|---|---|---|---|
Critical Count += 1 | CriticalCount | Add (+) | 1 |
Critical Count = 0 | CriticalCount | Overwrite (=) | 0 |
Variable: Action Stop | Action | Overwrite (=) | Machine Stop |
Variable: Action RUN | Action | Overwrite (=) | Machine Run |
Add (+) versus Overwrite (=)
Overwrite forgets the old value and writes a new one on top. Add takes the old value and adds to it. A counter needs Add, because it has to remember where it got to. A reset needs Overwrite, because the whole point is to throw the past away.
Part 3 · Average the reading and split it into bands
Wire the Time Interval Trigger into Moving Number Calculation, setting its Input Number to reference the Temperature variable and filling in Amount to Calculate and Calculation Type as described in Moving Number Calculation. This project uses Mean. Then send its result into a Variable: Modify that stores it in Temp Mean.
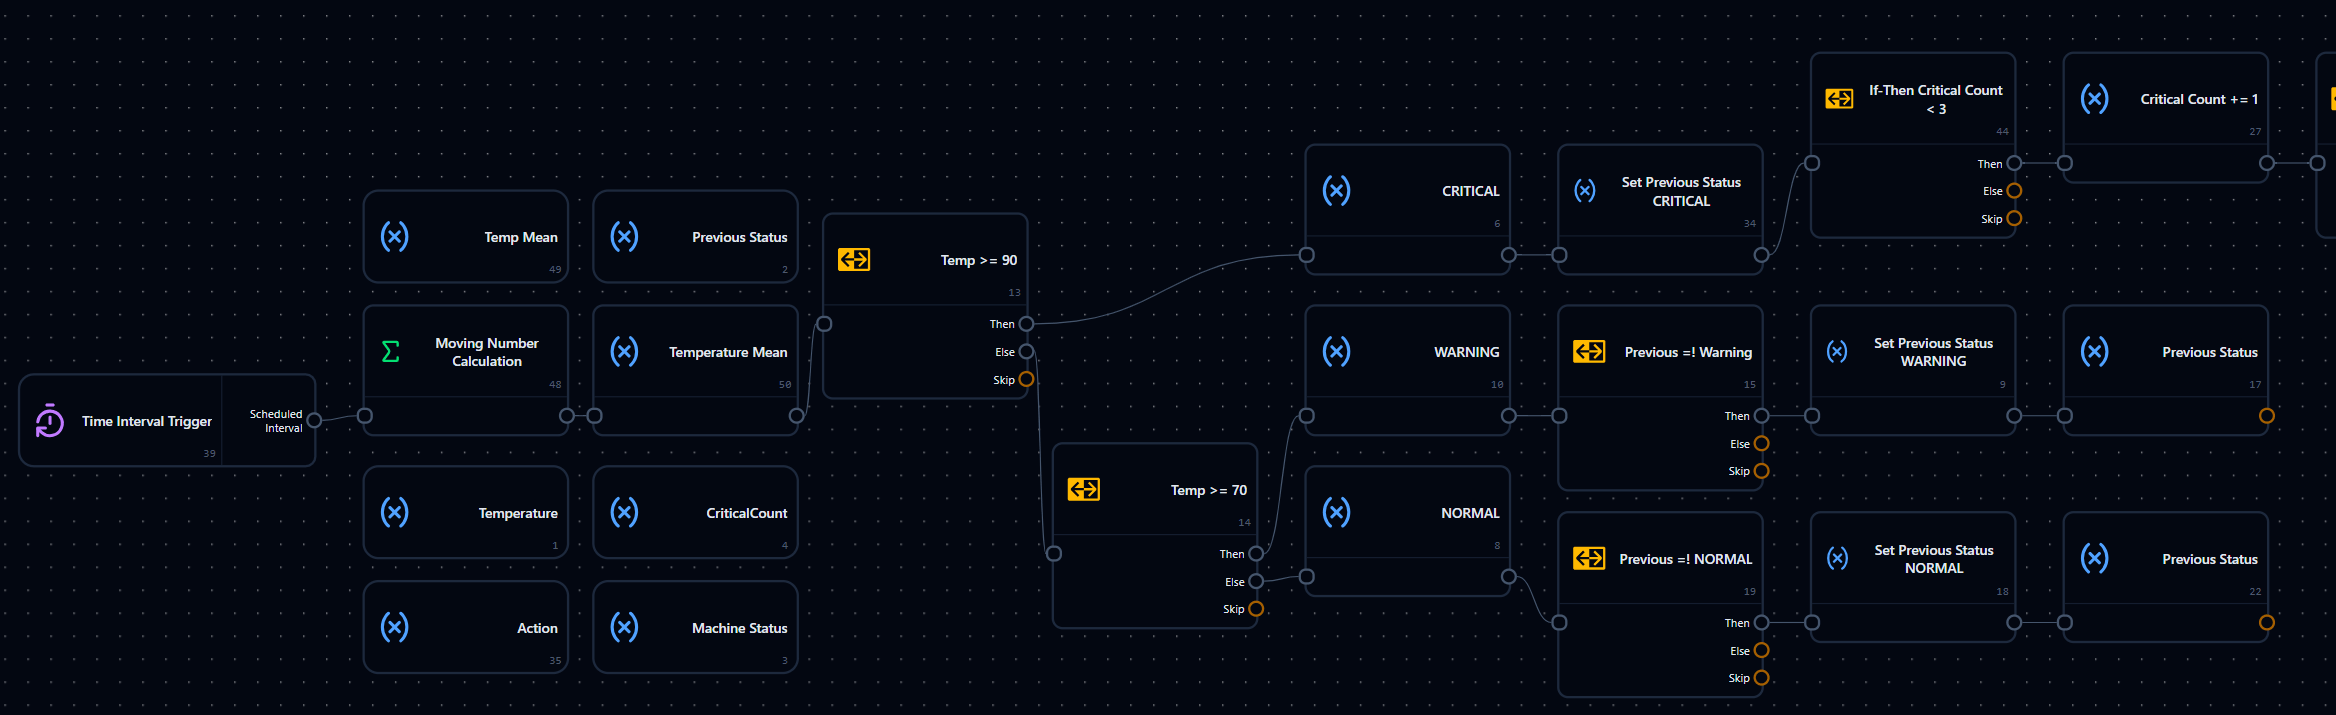
Now the important bit. Place two If-Then Nodes, nested. The first checks Temp >= 90; anything that fails falls out of the Else branch into the second, which checks Temp >= 70.
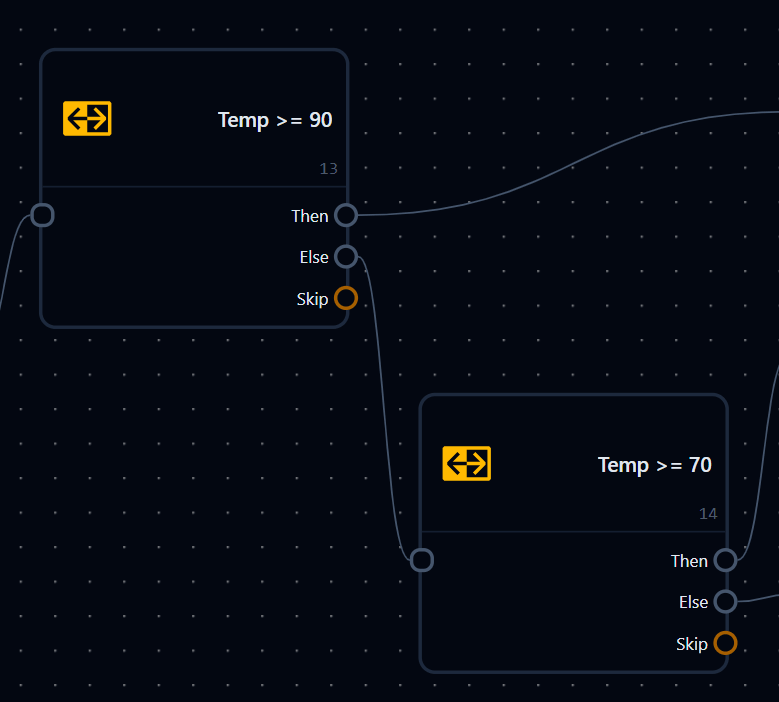
Both are configured the same way, differing only in the threshold:
| Parameter | Value | Notes |
|---|---|---|
| Condition Type | Number | Compare as numbers |
| Left-hand value | outValue from Moving Number Calculation | Use the average, not the raw slider value |
| Operator | Greater Than or Equal (≥) | |
| Right-hand value | 90 (70 on the other one) | The threshold being tested |
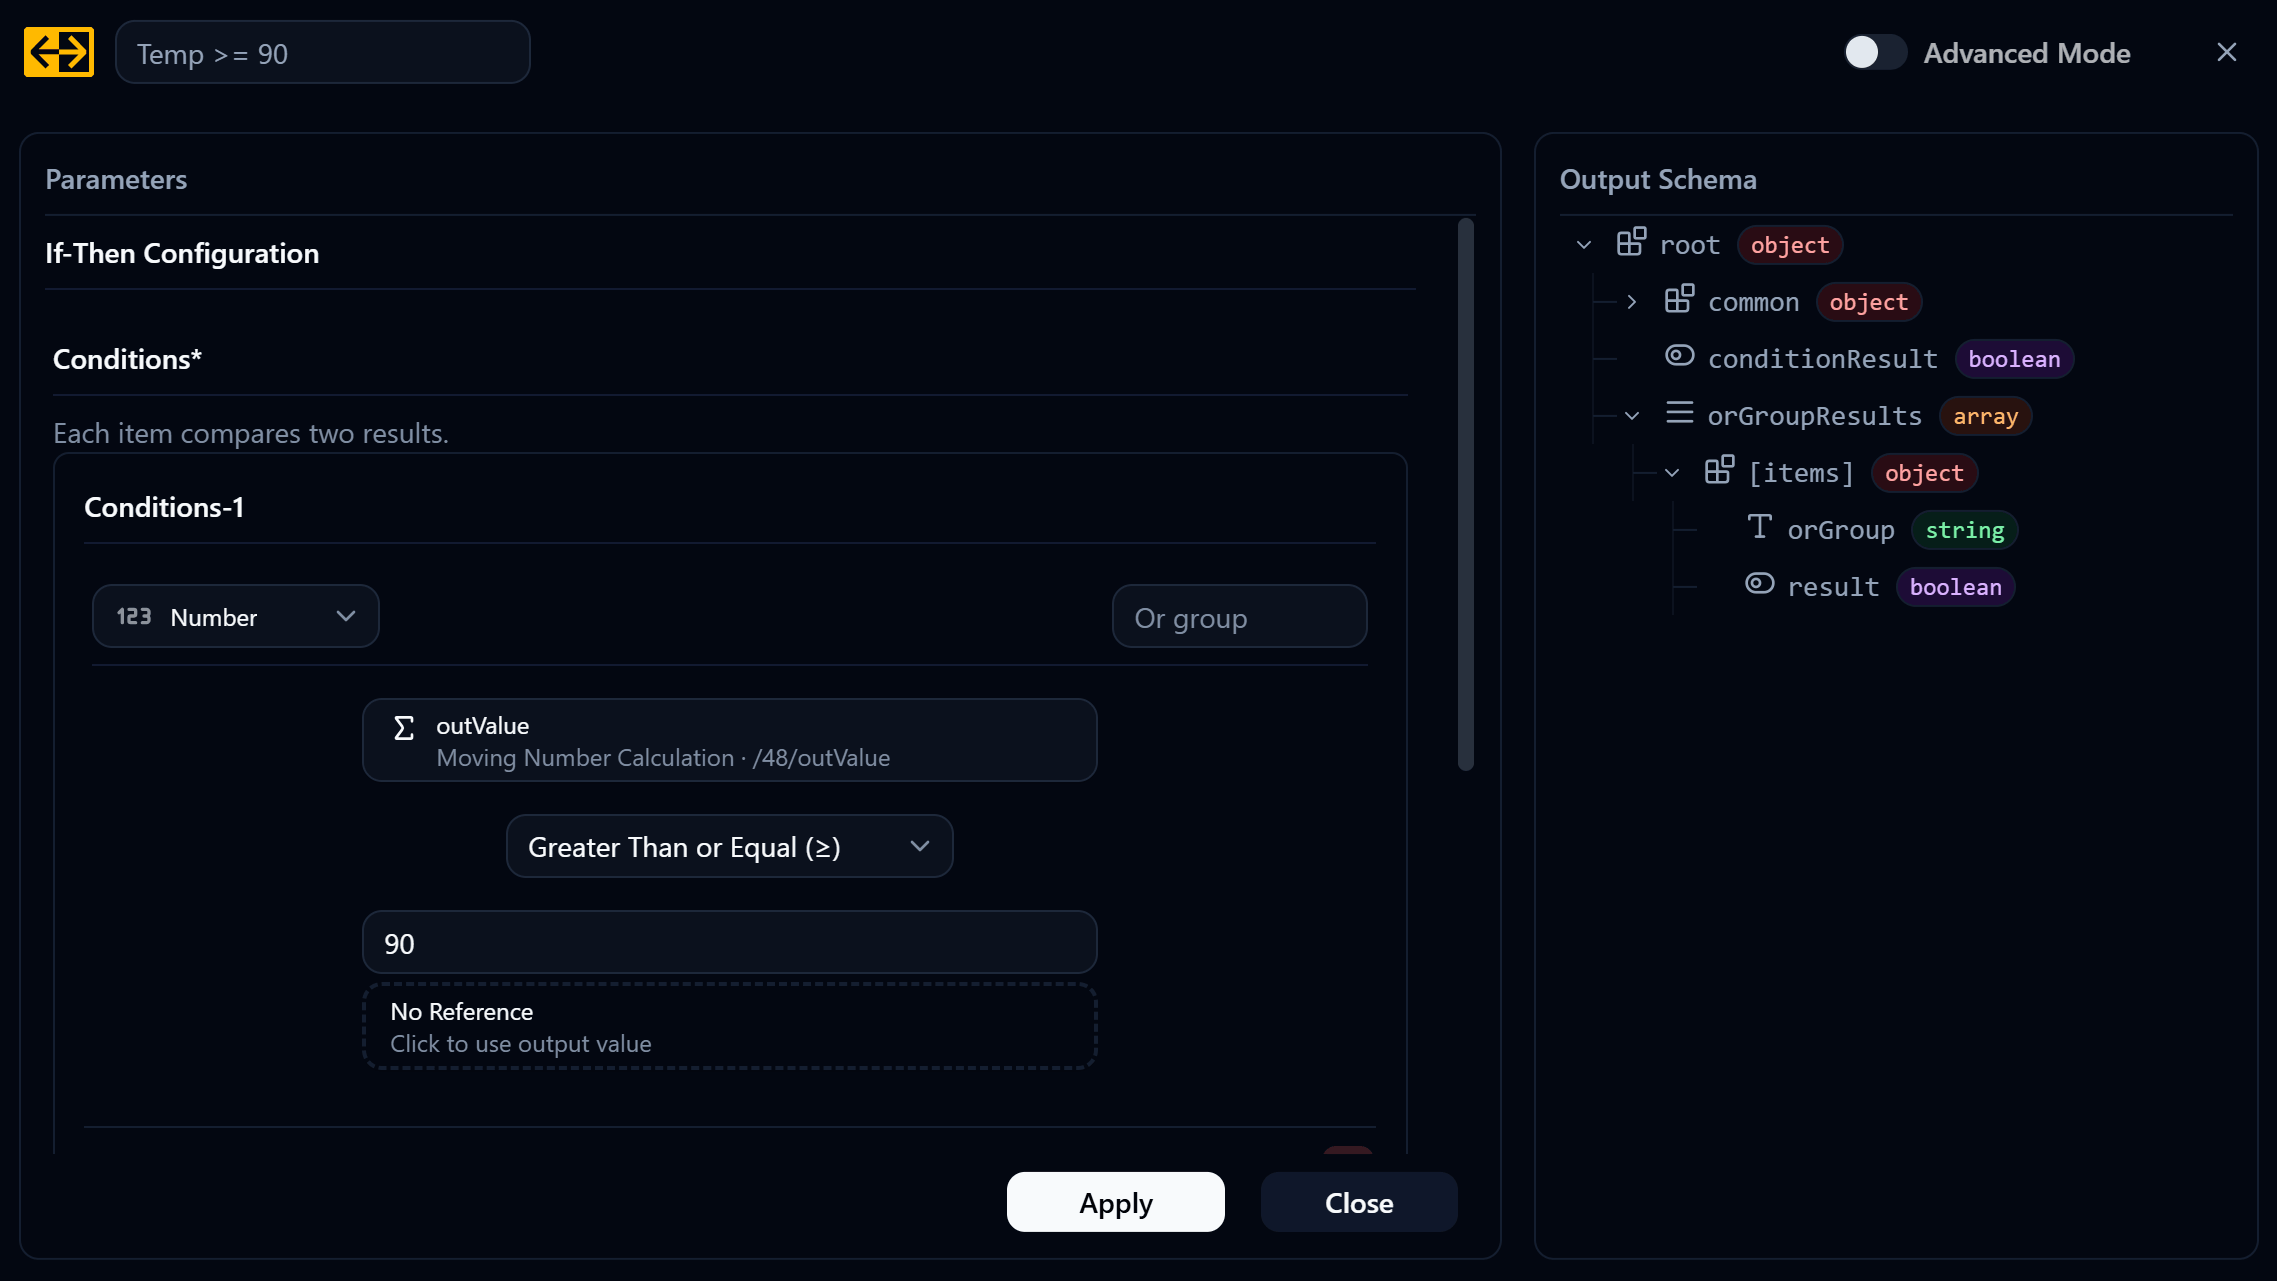
Try wiring this part yourself before looking at the answer. The chart below is what this section of the Flow has to do. Work out which box maps to which of the Nodes you laid out in Part 2, then connect them.
Once you've wired it, compare against this:
Why the Critical branch has no Previous Status check
The Warning and Normal branches each have an If-Then comparing against Previous Status before they write. The Critical branch writes straight through. That's because the counter gets added to the Critical branch in the next section, and that counter is meant to add on every pass the machine is still hot, not only the first one, so there's nothing to guard against.
One other thing: in the answer image you'll see an extra Node named Previous Status hanging off the end of the Warning and Normal branches with nothing wired after it. It has no effect on how the Flow runs. If you wired it the way the chart above shows, just skip it.
Part 4 · Lay out a basic Dashboard
Before adding complexity, test what you have. Go to the Dashboard and place these Widgets:
| Widget | Bound to | Notes |
|---|---|---|
Number Slider Temperature | the Temperature variable | Range 0–100, standing in for a real sensor |
Basic Display Current Temperature | the Temperature variable | Shows what you're feeding in |
Basic Display Machine Status | the Machine Status variable | The Flow's verdict |
Basic Display Mean Temp | the Temp Mean variable | The number the Flow actually judges on |
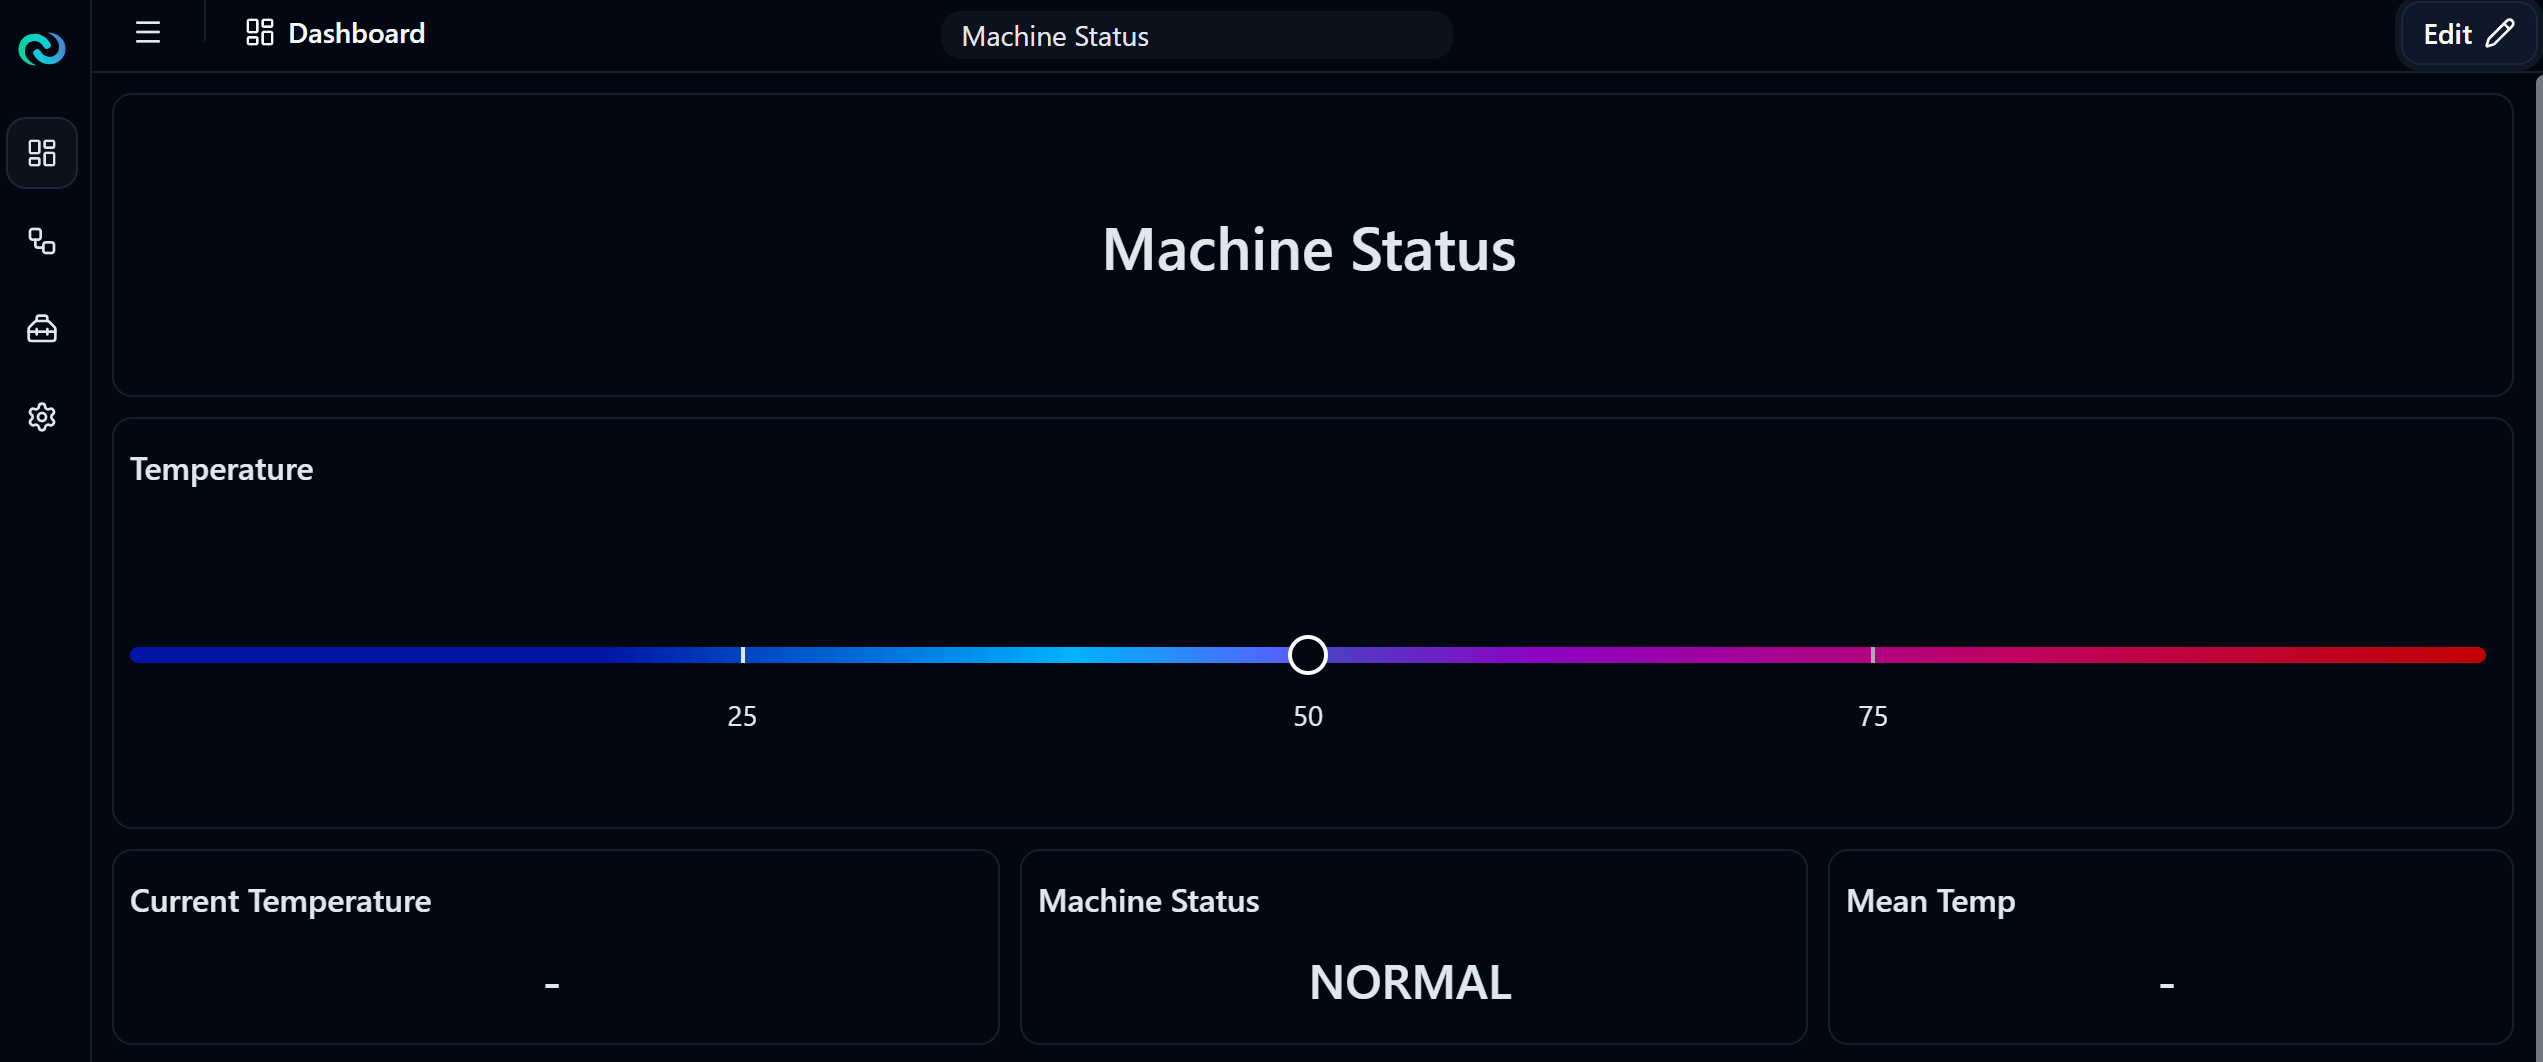
Deploy and move the slider. If the status follows the thresholds within the next pass, the first section works.
Watch these two readouts together
Push the slider up slowly and watch Current Temperature and Mean Temp side by side. The average always trails behind. That lag is what trading responsiveness for stability actually looks like.
Part 5 · Count the critical passes and stop the machine
Now that the basic Flow works, add the part that decides for you: if the machine has been critical for three passes, shut it down.
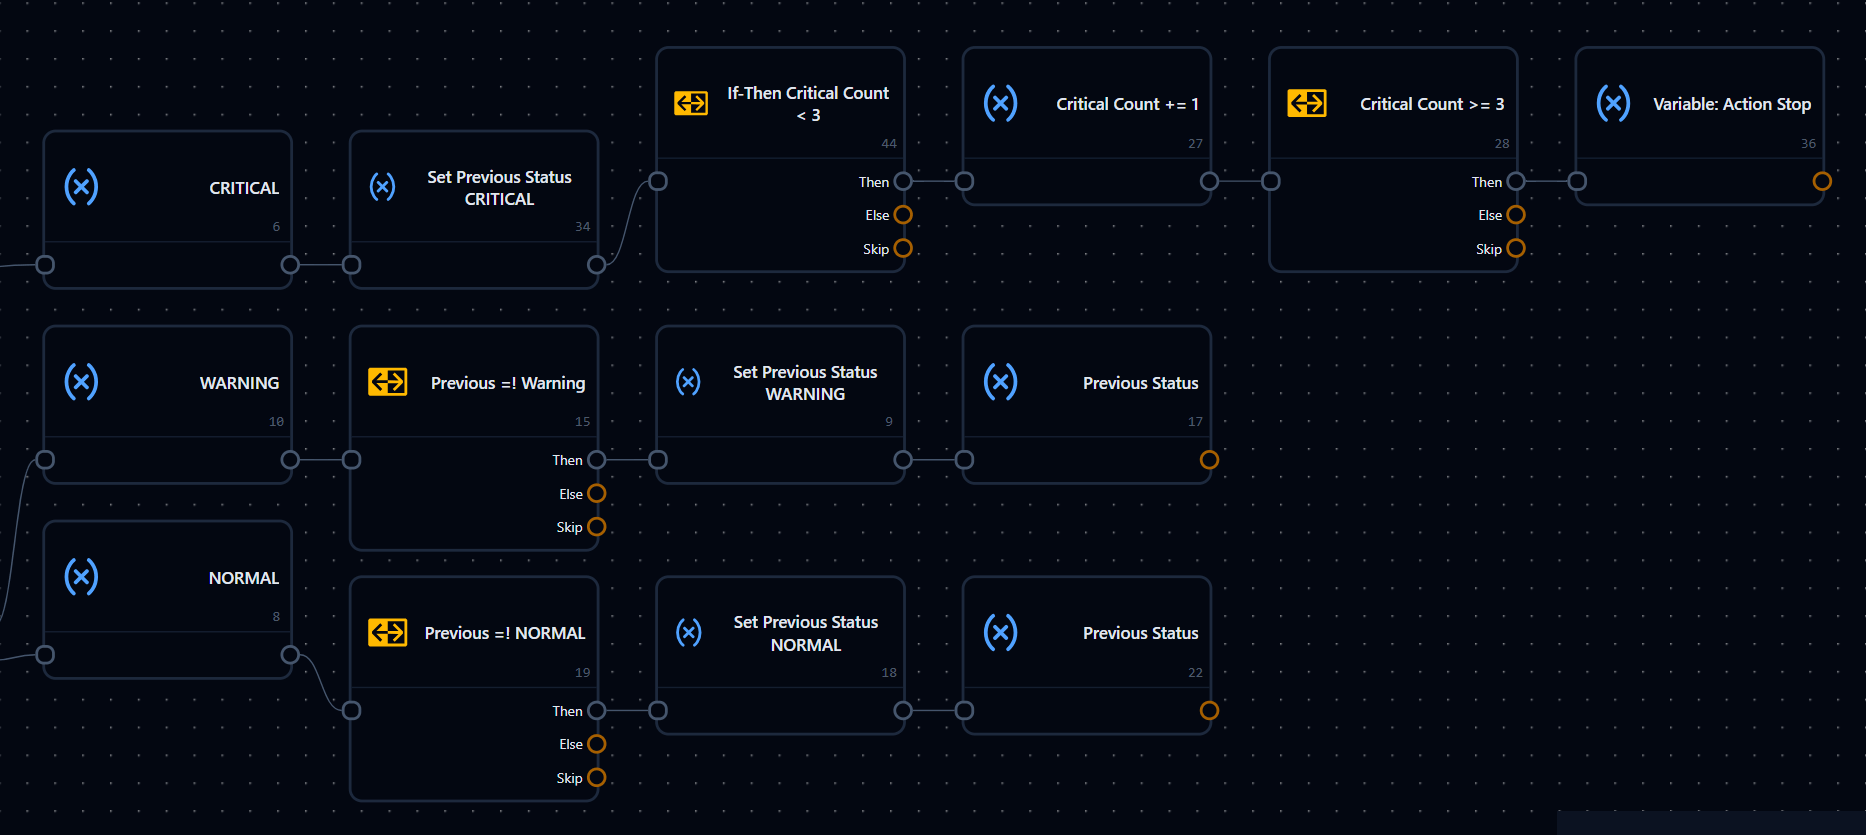
This extends the CRITICAL branch you already built. Try wiring it from the chart before looking at the answer.
The part that usually trips people up is why the counter gets checked twice. The first check, < 3, asks "can I still count?". The second, >= 3, asks "now that I've counted, have we hit the limit?". Two different questions at two different moments: one before the increment, one after.
Wired up, it looks like this:
Back on the Dashboard, add two more Basic Displays: one bound to CriticalCount, one bound to Action.
Deploy, then push the temperature above 90 and leave it there. Critical Count climbs one per pass, and the moment it touches 3, Action flips to Machine Stop and the counter sticks at 3.
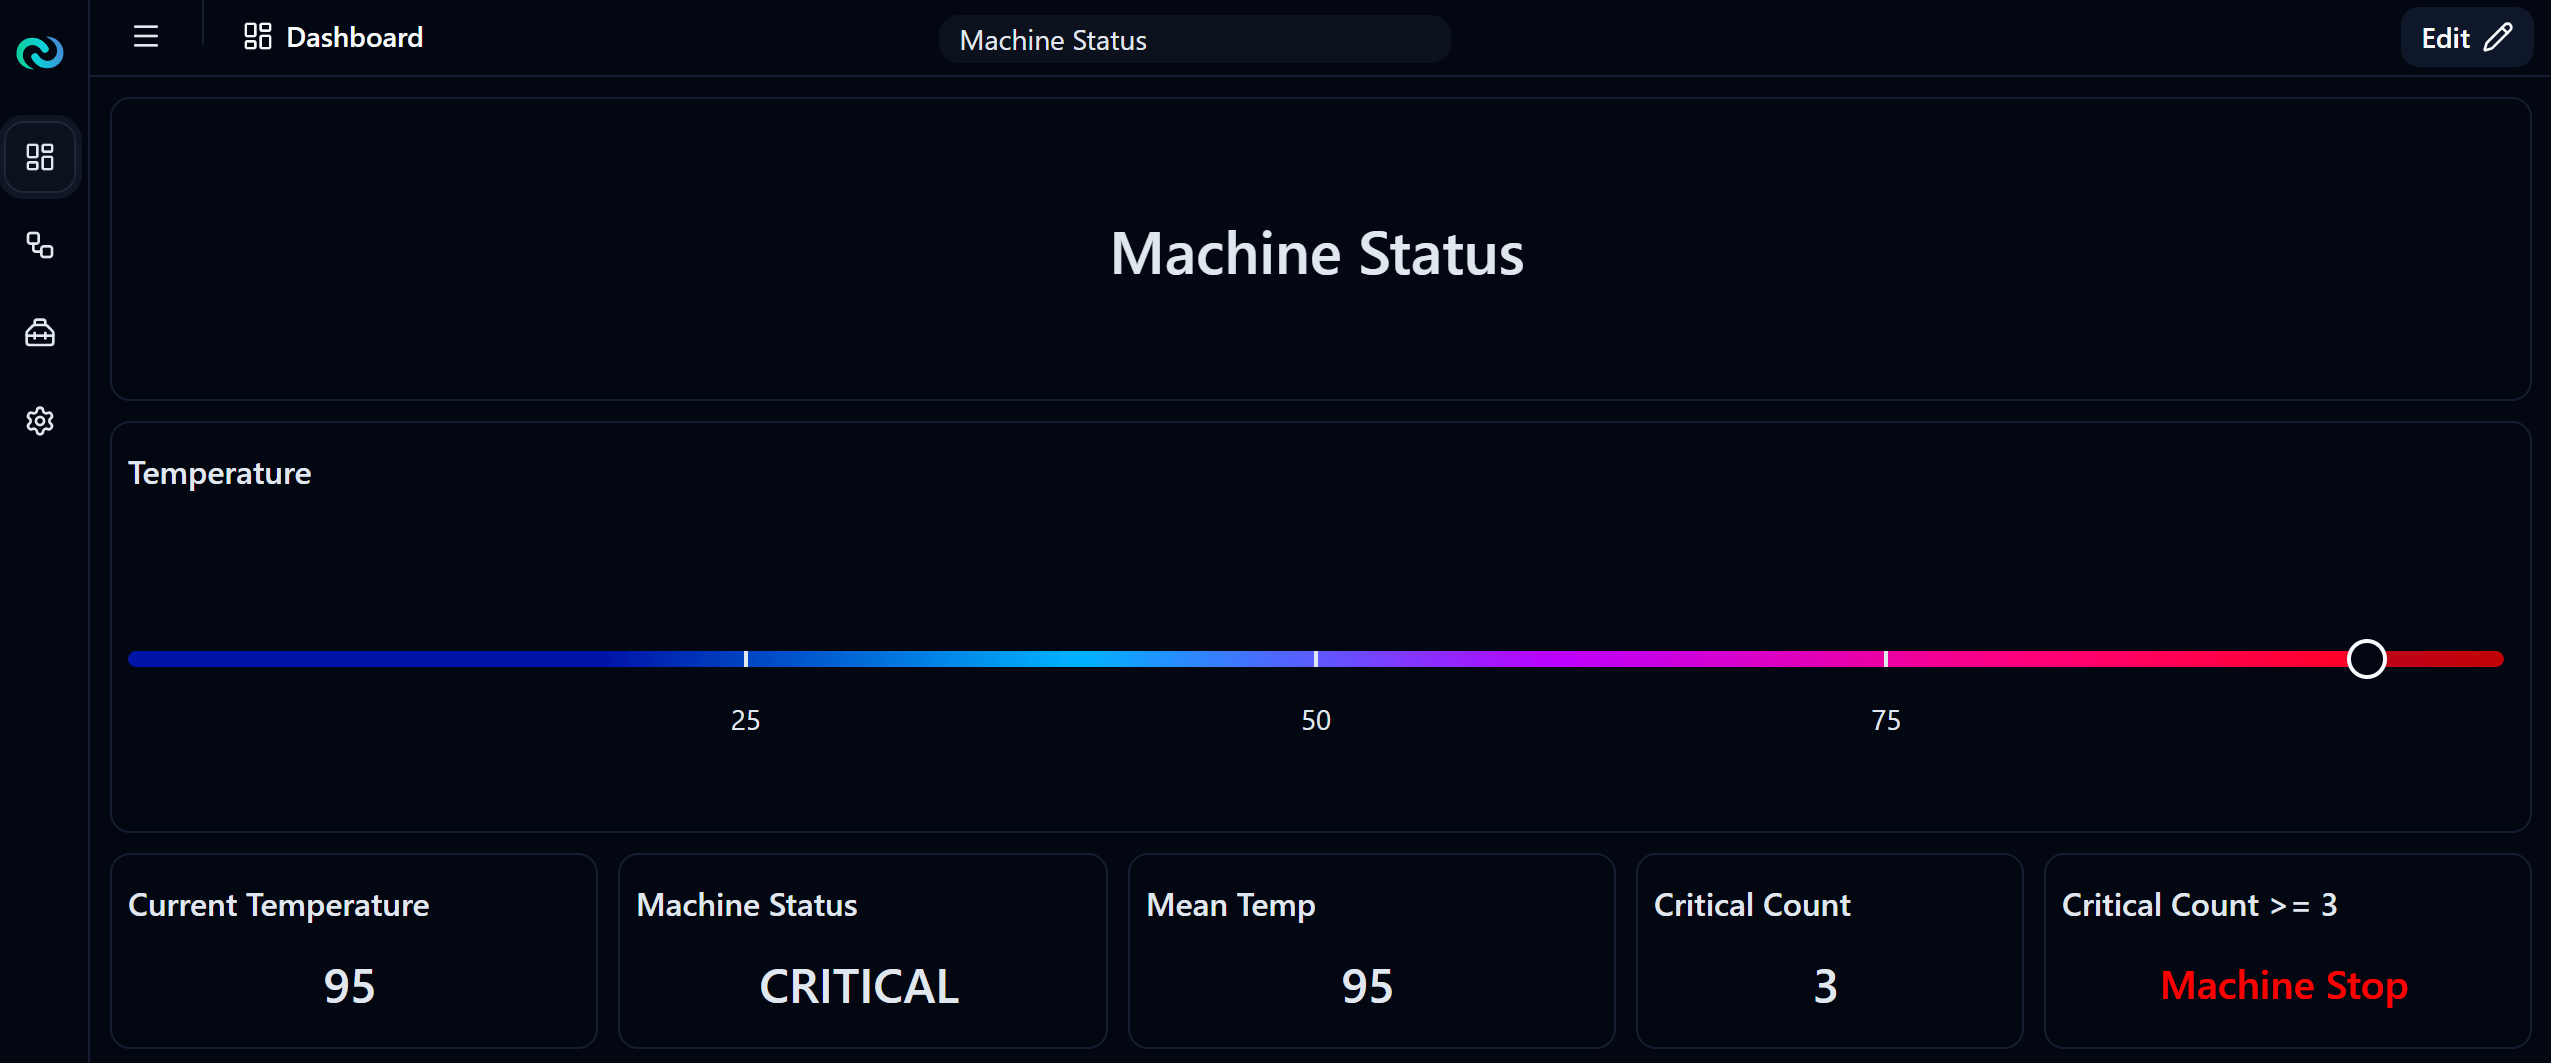
Now drop the temperature below 70. Machine Status goes back to NORMAL, but Action stays at Machine Stop. That is exactly the intended behaviour, and it's why the next section exists.
Part 6 · A Reset button with a condition
In a real plant, a machine that was stopped and then repaired has to be able to run again. But it has to come back deliberately, not by itself.
So the Reset button needs a gate: the status has to be back at NORMAL, which is the same as asking whether the average temperature has fallen below 70. Press it while the status is still CRITICAL or WARNING and nothing happens.
This section starts from a different Trigger than everything so far. Try wiring it from the chart first.
Wired up it's one long chain:

The last Node in that chain, Reset Temperature, writes the temperature back to a starting value. It's there so the hot readings still sitting in the average can't drag the status straight back to CRITICAL on the very next pass. The exact value doesn't matter as long as it's below the Warning threshold.
Finally, back on the Dashboard, add a Trigger Button named Reset Machine and bind it to this Dashboard Trigger. That completes the layout shown under Expected Result at the top of the page.
Try it like this: push the temperature up until the machine stops, then press Reset while it's still hot and watch nothing change. Now bring the temperature below 70, wait for the average to catch up, and press Reset again. This time the counter goes back to 0 and Action returns to Machine Run.
9. Flow Explanation
One pass of the Time Interval Trigger goes like this:
- The Trigger fires on schedule and hands off to Moving Number Calculation.
- Moving Number Calculation reads
Temperatureand averages it with recent readings, producing a steadier number. - That average is written into
Temp Meanso the Dashboard can show it. - The first If-Then compares the average against 90. Pass and it goes down Then; fail and it falls out of Else into the second If-Then, which compares against 70.
- Each branch writes its own status into
Machine Status, then remembers it inPrevious Status. - Only the Critical branch carries on to the If-Then checking
Critical Count < 3. If the ceiling hasn't been reached, the counter goes up by one. - After the increment, the If-Then checking
Critical Count >= 3asks whether the limit has now been hit. If it has,Machine Stopis written intoAction. - The next pass starts again from step 1.
The Reset path has nothing to do with the schedule. It only runs when someone presses the button:
- The Dashboard Trigger picks up the button press.
- The If-Then
Temp < 70checks whether the temperature really has come back down. If not, that's the end of it and nothing happens. - If it passes, the counter is cleared to 0 and both the status and the previous status are set to NORMAL.
Actionis written back toMachine Run.- The temperature is cleared, so an old reading can't pull the status straight back to critical on the next pass.
Notice the counter is never cleared on the normal path
However many passes the temperature spends at NORMAL, the counter doesn't come down. The only way to clear it is through the Reset button. That's what lets the number on the Dashboard answer a useful question: since the last time somebody cleared this, how many passes has this machine spent overheating?
10. Testing Scenarios
| Scenario | How to test | Expected result |
|---|---|---|
| Basic status | Set the temperature to 50, then 75, then 95, waiting a pass each time | Machine Status shows NORMAL, WARNING, CRITICAL in turn |
| The average trails | Jump from 40 straight to 95 | Current Temperature changes at once, Mean Temp climbs gradually, status changes a pass or two later |
| The counter climbs | Hold at 95 and watch three passes | Critical Count goes 1 → 2 → 3 |
| The ceiling holds | Keep holding at 95 for several more passes | Critical Count stays at 3 |
| The machine stops | Watch the Action readout as the counter reaches 3 | It changes to Machine Stop |
| The command persists | Drop to 40 and wait several passes | Machine Status returns to NORMAL but Action is still Machine Stop |
| Reset while hot | Hold at 95 and press Reset Machine | Nothing changes, the counter is still 3 |
| Reset once cool | Drop to 40, wait for Mean Temp to fall below 70, press Reset | Critical Count returns to 0 and Action returns to Machine Run |
11. Troubleshooting
- The status never changes no matter how you move the slider: Check that the Number Slider is bound to the
Temperaturevariable, and that Moving Number Calculation reads from that same variable. If the Widget writes to one variable and the Flow reads another, they will never meet. - The temperature is high but the status is stuck on WARNING: The If-Then Nodes are in the wrong order. The one checking
>= 90has to come first. Check 70 first and anything above 90 gets caught by that test and never reaches the Critical branch. - The status reacts much more slowly than expected: That's the averaging. To speed it up, reduce how many past readings go into the average, at the cost of the status becoming twitchier around the thresholds.
- Critical Count climbs without stopping: The If-Then checking
Critical Count < 3isn't sitting in front of the increment, or its Then and Else are swapped. Follow the wire out of Then and confirm it lands onCritical Count += 1. - The counter climbs but Action never becomes Machine Stop: Check that the If-Then
Critical Count >= 3sits after the Node that increments. Put it before and it reads the old value, so when the counter really is 3 the condition still sees 2. - Reset does nothing even though the temperature is low: Look at Mean Temp, not Current Temperature. The button's condition compares against the average, which always trails the real value. Wait a couple more passes and press it again.
- Reset works, but the status goes straight back to CRITICAL on the next pass: That's exactly what the
Reset TemperatureNode is there to prevent. Without it, the hot readings still sitting in the average pull the status right back up.
12. Challenges and Summary
Challenge 1: Turn the counter into an event counter instead of a pass counter, by adding an If-Then against Previous Status in the Critical branch, the way the Warning and Normal branches already have one. You'll get a counter that adds one per entry into the critical range. Compare the two and think about what each version is really telling you.
Challenge 2: Take the alert outside the system. Use what you learned in Email · Sending Email from a Flow to send a message at the moment Action is set to Machine Stop. Hang the email Node straight off that one, since it already fires only once.
Challenge 3: Keep a history. Use a Database Table to write a row every time the status changes, or every time Reset is pressed, along with the timestamp and the temperature at that moment. Show it with an Array Object Table.
Challenge 4: Add an XY Number Chart plotting temperature over time, with the raw value and the average as two lines on the same chart, so you can see for yourself how much the averaging smooths out.
Challenge 5: Fix the flicker at the threshold edges by using different thresholds going up and coming down: enter Critical at 90, but only drop back to Warning below 85.
Summary: This project turns a stream of numbers into a status a person can read, and then turns that status into a command a machine can obey. It averages so the decision doesn't chase noise, checks thresholds from high to low so the bands split correctly, counts with a ceiling so the number still means something once the limit is passed, and keeps the command separate from the status so the system never quietly reverses its own decision.
Measurements change with reality every second, while a command that has already gone out should stay until a person cancels it. Keeping the two apart is the standard way to build anything where somebody has to be accountable for a decision, not just temperature.
Ready for what's next
Now that the Flow can decide and act, move on to Mini Project 3 · Conveyor Parcel Processing, which applies the same ideas to events happening in a moving image.
Mini Project 1 · Danger Zone Monitoring
Practice building a Flow that reads video, detects people with a pre-trained model, counts how many are standing inside a defined zone, and raises an alert when someone walks into the danger area.
Mini Project 3 · Conveyor Parcel Processing
Practice building a Flow that reads conveyor footage, detects parcels, tracks them across frames, counts only when a box crosses a line, then sorts the boxes with a Switch Case before writing them to a database.