
Moving Number Calculation
Use the Moving Number Calculation Node to work out a figure from the last few numbers that arrived, such as a moving average, a maximum, or a minimum, with a workshop that feeds values from a Slider and watches the average follow.
Numbers that arrive in a stream, like a temperature reading or a conveyor speed, are never still. Decide on the raw values and the result flickers while nothing about the real thing has changed. The Moving Number Calculation Node exists for this: it holds on to the last few numbers and works them into a single figure for the next Node to use.
1. How it works in general
Suppose the Node is configured to use the three most recent numbers. Each new number is added to the calculation. After three values have been stored, adding another value removes the oldest one. The Node then recalculates the result using the latest three values.
feed 75          [75]              → 75
feed 85          [75, 85]          → 80
feed 90          [75, 85, 90]      → 83.33
feed 60      75 ⟵ [85, 90, 60]     → 78.33
feed 0       85 ⟵ [90, 60, 0]      → 50
The calculation is described as moving because the set of values changes whenever a new value arrives. The result reflects the most recent values rather than every value received since the Flow started.
What you get out of it is a steadier number: one reading that jumps out of line gets absorbed by its neighbours. It also follows the real value more slowly, because a new number can only pull the average so far until the older ones have dropped out.
2. How Moving Number Calculation works in NARA
This Node sits under Process in the Node panel. Where the Operation chapter was about Nodes that decide where a Flow goes, this one works on the numbers themselves. It takes one number in and sends one number out. The key thing is that one pass of the Flow through this Node is one new value fed in. The Flow must therefore run repeatedly to update the calculation, whether from a While Loop, a Time Interval Trigger, or a button press.
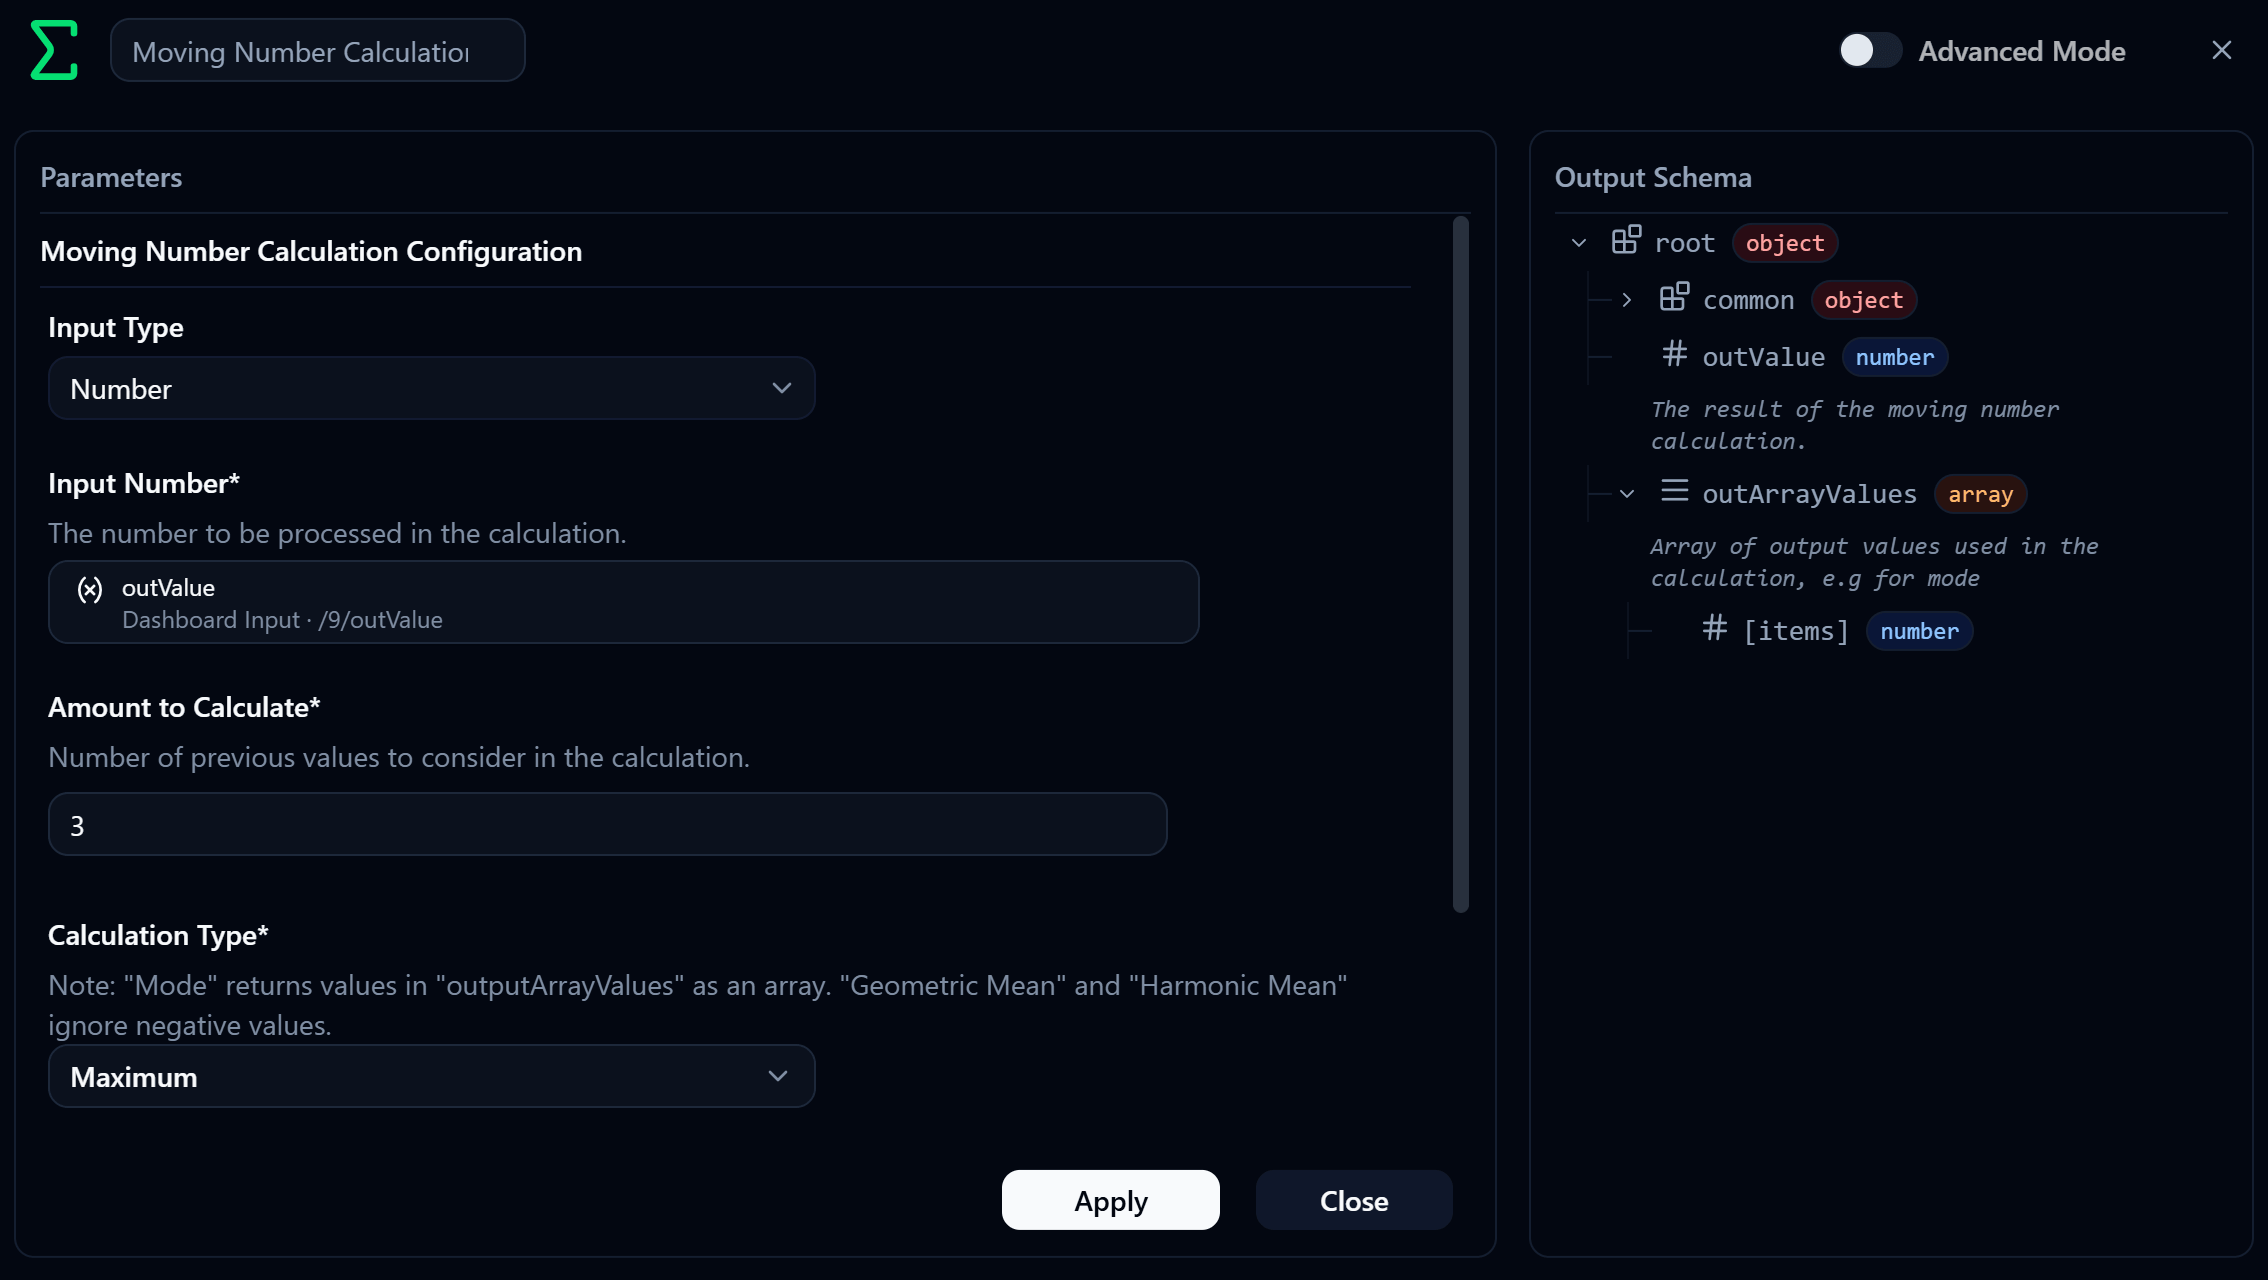
Configure the following five parameters:
| Parameter | What it means |
|---|---|
| Input Type | The type of value coming in. Here it is Number |
| Input Number | The value to include in the calculation. Select a Reference to the source Node's Output |
| Amount to Calculate | The number of recent values included in the calculation |
| Calculation Type | Which calculation to run over the values held |
| Prefill With Value | Whether to prefill the stored values using the first input. Leave this disabled in this chapter |
On the Output side there are two:
- outValue number the result of the calculation, and what you'll use in almost every case
- outArrayValues array the set of values used in that pass, there for cases where the answer can be more than one value, such as Mode
Calculation Type
The Calculation Type dropdown provides 14 options. They can be grouped by purpose as follows:
- Representative values: Mean, Median, Mode, Geometric Mean, Harmonic Mean, and Root Mean Square
- Limits and range: Minimum, Maximum, Range, and Mid-range (max - min)
- Variation: Standard Deviation and Variance
- Other calculations: Sum and Regression Coefficient
Use Mean to smooth a sequence of sensor readings, as demonstrated in this Workshop and Mini Project 2. If the readings may contain occasional outliers, Median can provide a more stable representative value because a single extreme value has less effect on the result. Use Standard Deviation when you need to measure how widely the readings vary rather than calculate a representative value.
Pay attention to the following output and input behavior:
- Mode returns the most frequent value. More than one value may share the highest frequency, so the result is provided through
outArrayValuesas an Array rather than throughoutValue. - Geometric Mean and Harmonic Mean ignore negative input values. Do not use these calculations when negative readings must be included in the result.
3. Workshop · A moving average
Build a small Flow that lets someone pick a number on a slider on the Dashboard, press a Trigger button to feed that one value in, and get the average of the last three values back on screen.
Having a person press the button makes one thing obvious: one press is one new value. Move the slider around as much as you like and nothing happens until you press it.
The finished Flow looks like this:
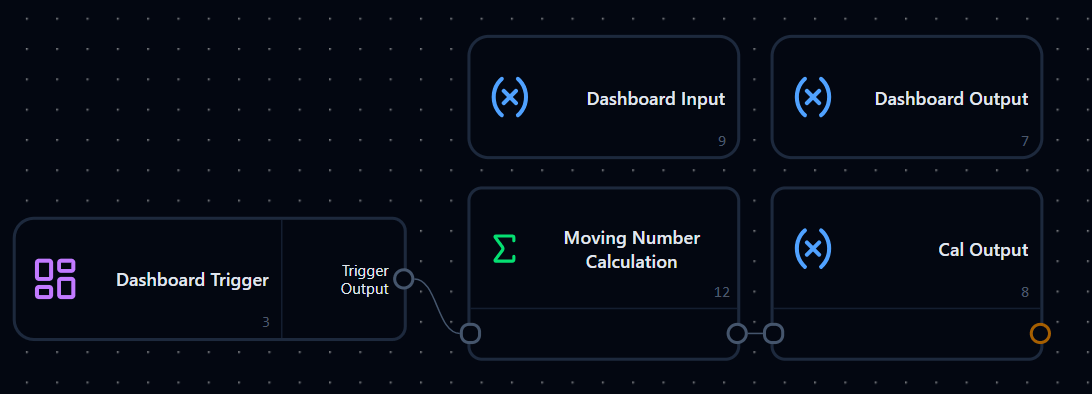
As a diagram:
The dotted lines are reads and writes through variables, not wires between Nodes.
4. Workshop · The Dashboard side
The Dashboard uses four Widgets:
| Widget | Role | Variable Source |
|---|---|---|
| Number Slider | Lets the user pick the number to feed in | Dashboard Input |
| Trigger Button | Sends the selected value into the Flow | Not applicable |
| Basic Display | Shows the value just fed in | Dashboard Input |
| Basic Display | Shows the calculated result | Dashboard Output |
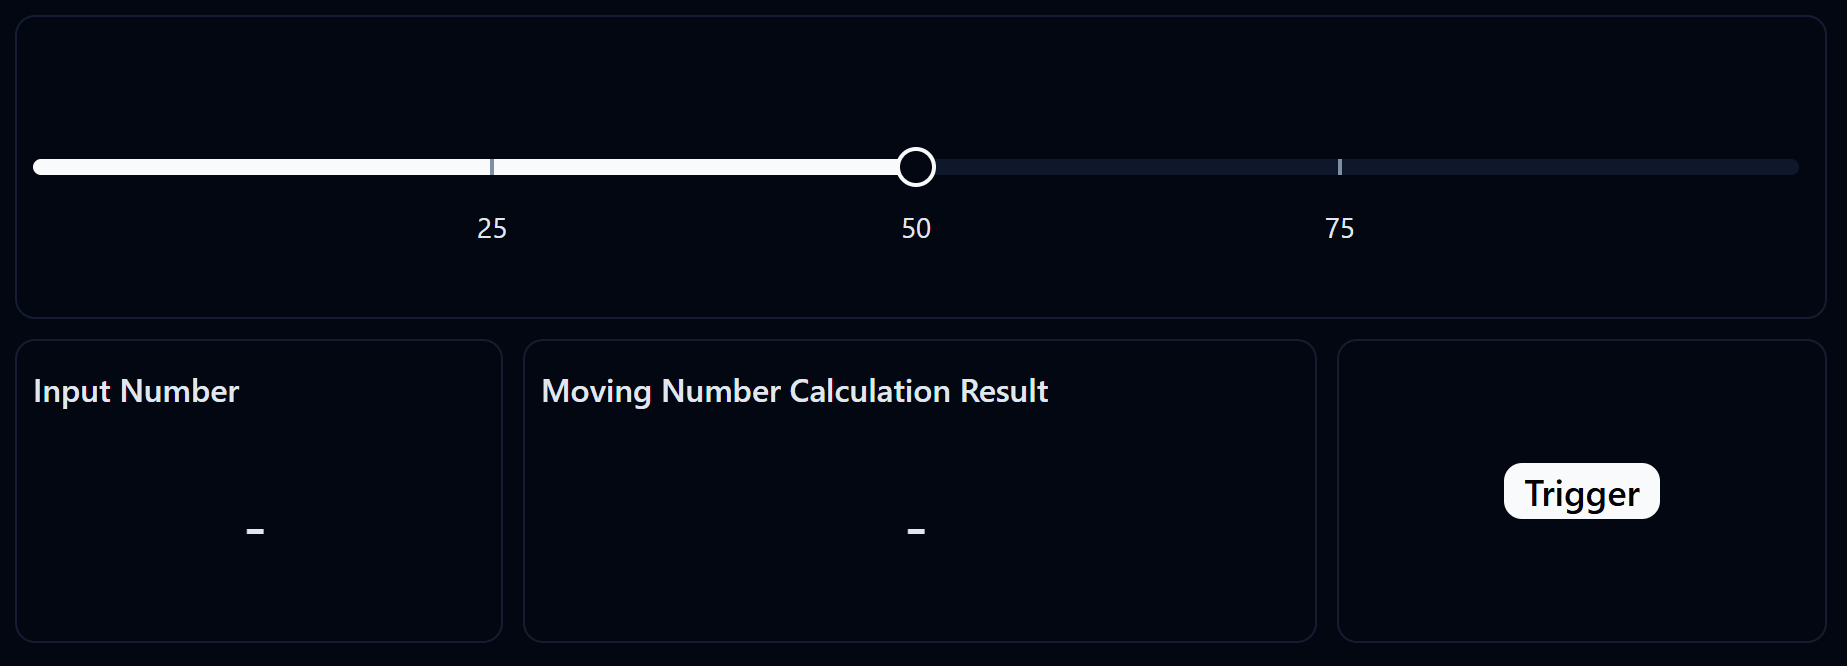
On the Flow side, create two Variable: Create Nodes to match:
| Variable | Type | What it holds |
|---|---|---|
Dashboard Input | number | Takes the value from the slider and hands it to the calculation |
Dashboard Output | number | Holds the result for the Widget to read |
The Flow starts from a Dashboard Trigger bound to the Trigger button.
5. Workshop · Configuring the Node
Wire the Dashboard Trigger into Moving Number Calculation and set it up like this:
| Parameter | Value | Description |
|---|---|---|
| Input Type | Number | The incoming value is a number |
| Input Number | outValue from the Dashboard Input Node | Whatever the user just picked on the slider |
| Amount to Calculate | 3 | Keep the last three values |
| Calculation Type | Mean | Work out the arithmetic average |
| Prefill With Value | Off | Begin the calculation with the values received during each run |
Try different Calculation Types
The example in section 2 uses Maximum, which returns the largest value among the recent values being calculated. This Workshop uses Mean to calculate the average of the three most recent values. After completing the Workshop, try other Calculation Types and compare how each option changes the result.
Then add a Variable: Modify at the end of the calculation, named Cal Output, to take the result and store it where the Widget is looking.
| Parameter | Value | Description |
|---|---|---|
| Variable Source | Dashboard Output | The variable the Widget reads from |
| Assign Mode | Overwrite (=) | Replace the previous result each pass |
| Variable Value | outValue from Moving Number Calculation | The figure just calculated |
Why the extra variable in between
Widgets on the Dashboard read from variables, not from a Node's Output directly. The Cal Output Node is the bridge: it takes the result from the calculation and writes it into a variable the Widget can see. It's the same pattern every workshop in this chapter uses.
6. Trying it out
Deploy, move the slider to 75, and press Trigger. Both readouts show 75 because only one value has been received, and the average of one value is that value.
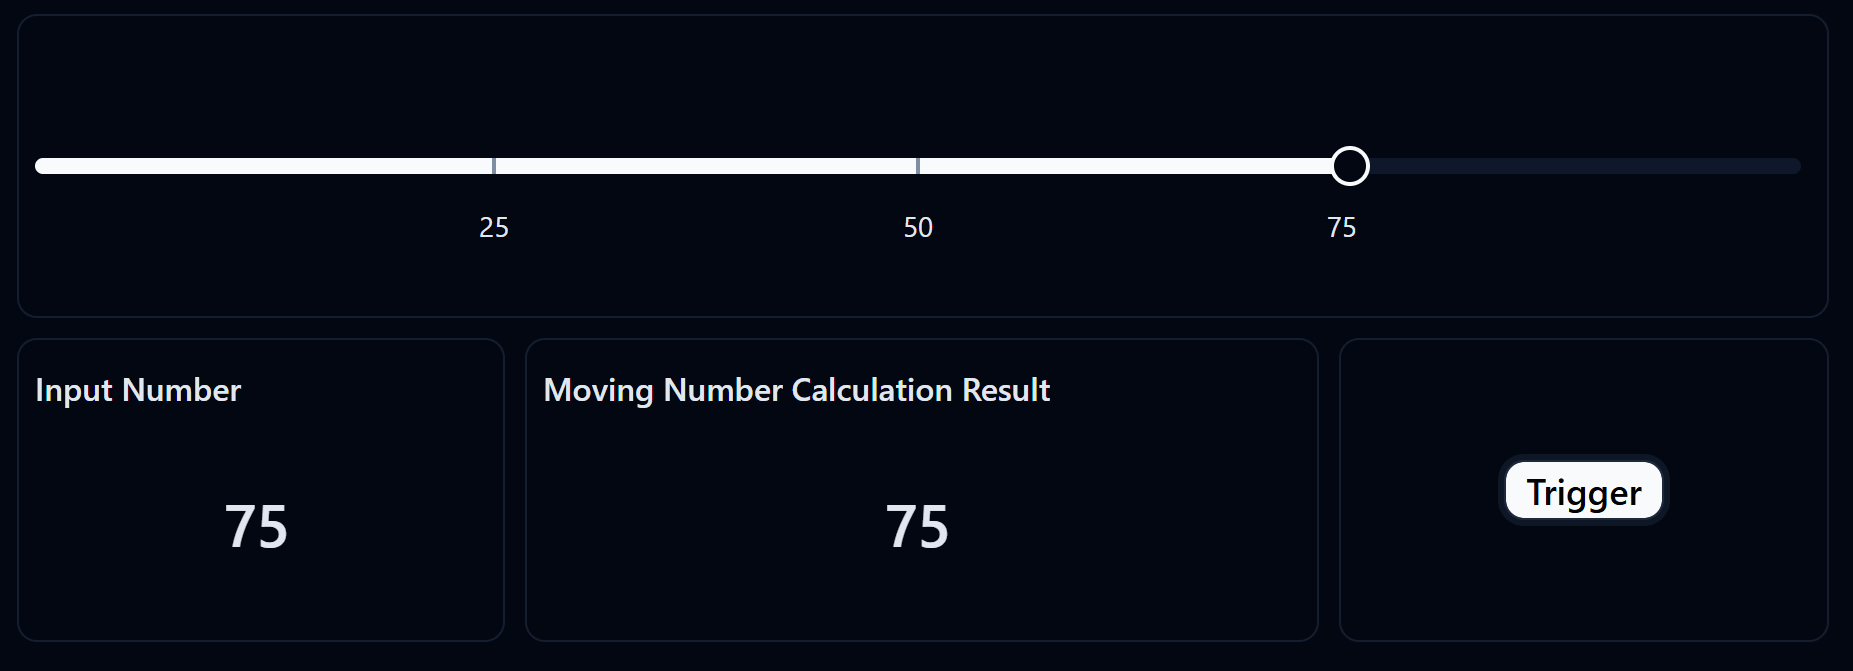
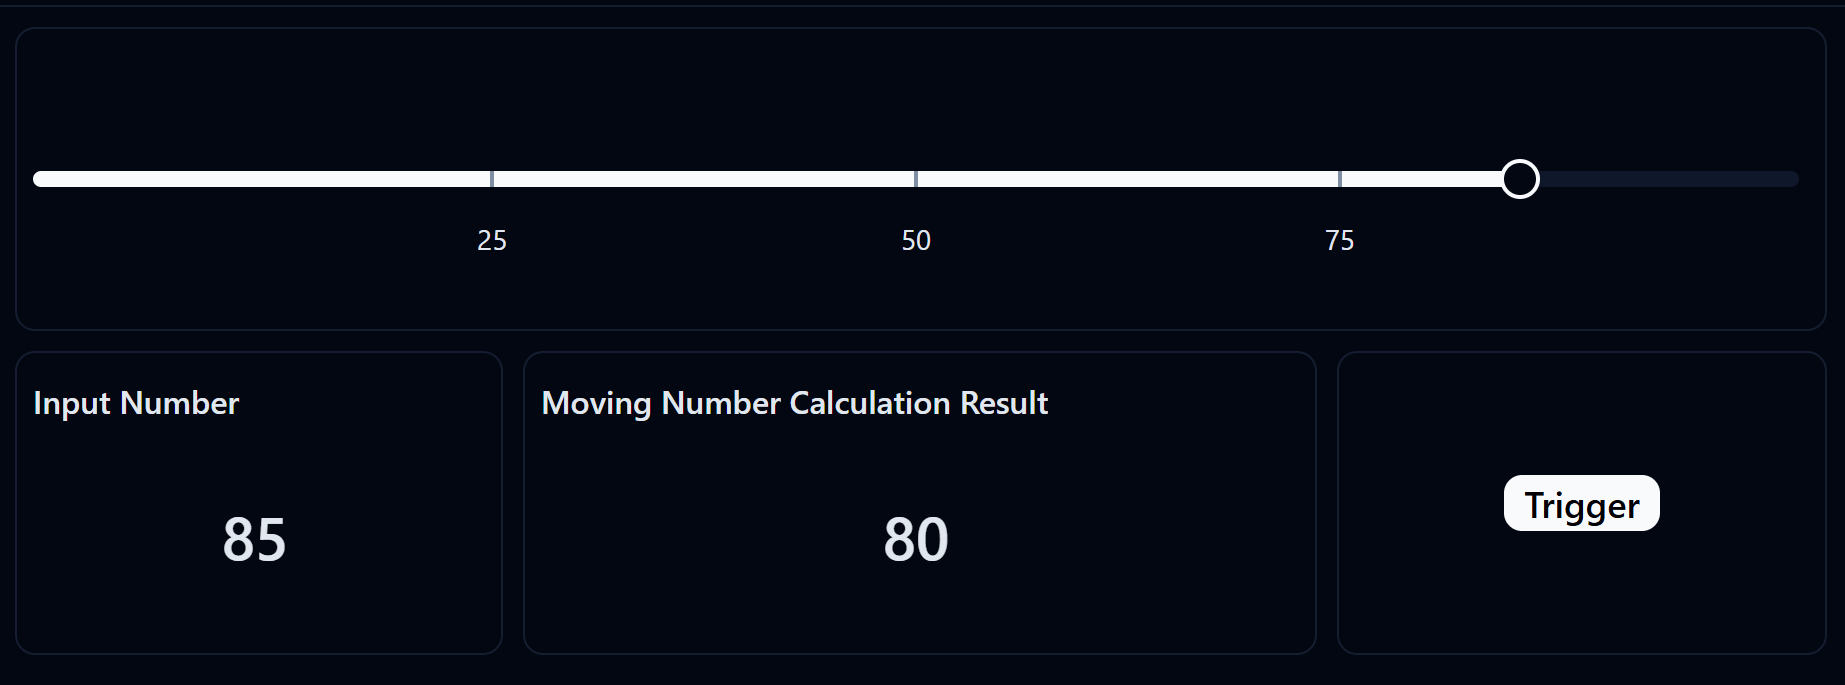
Move to 85 and press Trigger again. The result reads 80, the average of 75 and 85.
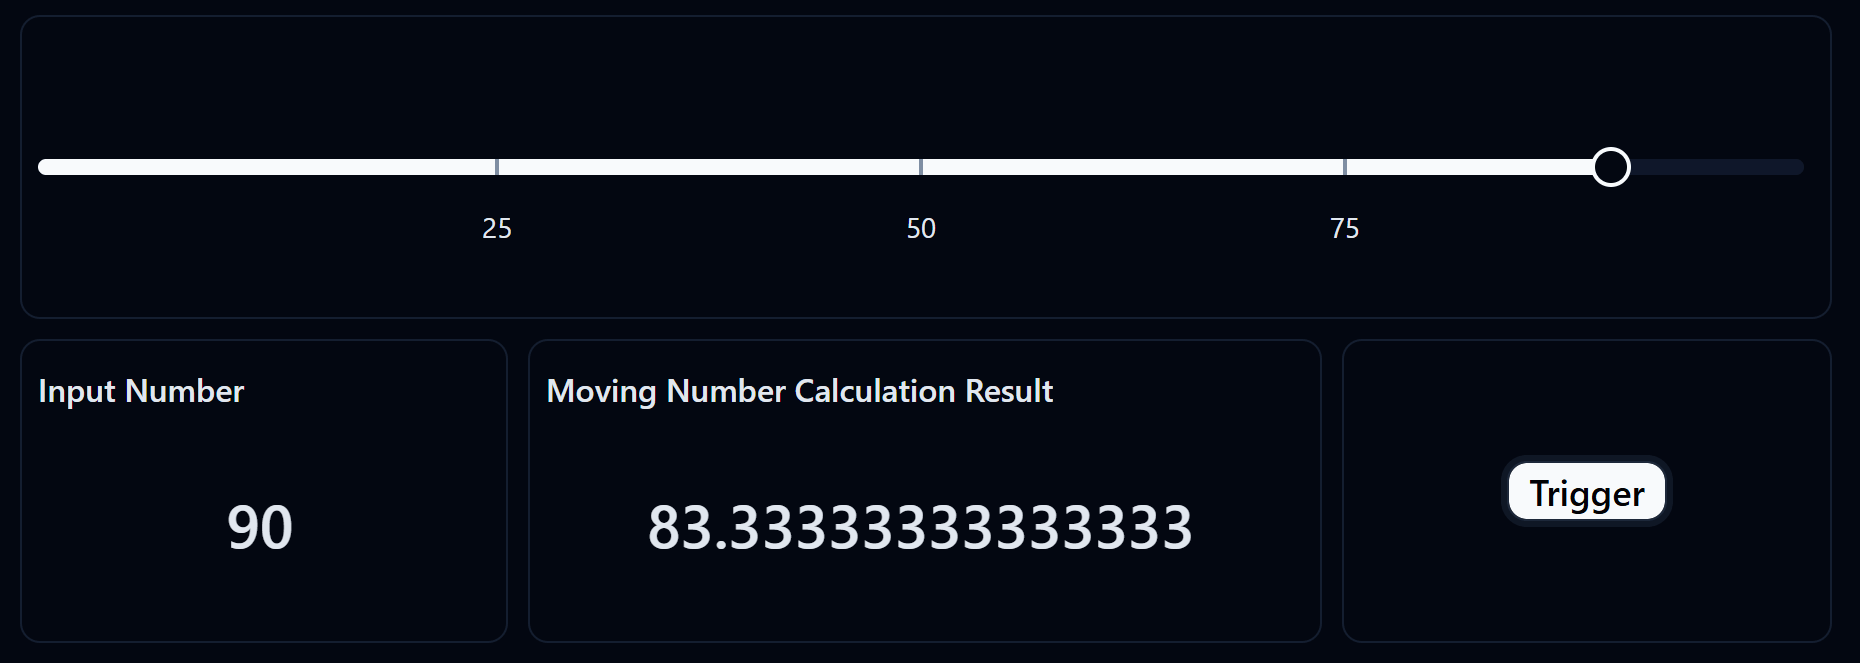
Feed in 90 as the third value. The Node now has three values to calculate, and the result becomes 83.33333..., which is (75 + 85 + 90) ÷ 3.
Keep going and you'll see the older values start dropping out of the calculation:
| Press | Value fed in | Values included in the calculation | Result |
|---|---|---|---|
| 1 | 75 | 75 | 75 |
| 2 | 85 | 75, 85 | 80 |
| 3 | 90 | 75, 85, 90 | 83.33 |
| 4 | 60 | 85, 90, 60 | 78.33 |
| 5 | 0 | 90, 60, 0 | 50 |
On press 4, the original value of 75 is no longer included because Amount to Calculate is set to 3.
Try changing Amount to Calculate
Set Amount to Calculate to 5, then enter the same sequence again. The result will change more gradually because each calculation includes more recent values. A larger number can smooth noisy readings but may respond more slowly to a sudden change. A smaller number responds faster but provides less smoothing. Choose the value based on how much smoothing and response speed the task requires.
If the results aren't what you expect, work through these:
| Symptom | Likely cause |
|---|---|
| Pressing Trigger does nothing | The Dashboard Trigger isn't bound to the Trigger button |
| The result readout is always empty | The Widget's Variable Source isn't Dashboard Output, or the Cal Output Node isn't wired in |
| The result always equals the value just fed in | Amount to Calculate is set to 1, so each calculation includes only the latest value |
| The result is the largest value, not the average | Calculation Type is still Maximum rather than Mean |
| Nothing follows the slider | The Number Slider and the Node's Input Number point at different variables |
| The result has a very long decimal | Normal for a division that doesn't come out even. Round it at display time if you want it tidier |
Next
That is the Process chapter done. Next comes keeping data around to look at later, at Database Table · Storing data in a table.
Switch Case · Creating multiple paths from one value
Use Switch Case to compare one value with up to four Cases, then build a Workshop that converts a machine mode number into a status message.
Database Table · Storing data in a table
Create a table with DB Table Initialize, define its Columns, and write rows with DB Table Row Insert or Modify, with a workshop that stores what the user enters on the Dashboard.